The AMD Threadripper 2 CPU Review: The 24-Core 2970WX and 12-Core 2920X Tested
by Ian Cutress on October 29, 2018 9:00 AM ESTPower Consumption and Uncore Update: Every TR2 CPU
As part of the 2990WX and 2950X review, we published data looking at the core, package, and uncore power delivery on the Threadripper 2 processors. A lot of users were skeptical of our data, which we had expected, and on the basis of comments and discussions, we slightly changed our testing and layout to get a better understanding of what is going on.
Our previous testing involved taking per-core power measurements, and full package power measurements, under a CPU load with a set number of threads. In the first instance, our load was common Prime95, which could be set for a fixed number of threads. Unfortunately, as observed, Prime95 is not a great program on a per-thread level – it works best when all cores are maxed. As a result, we have since moved to POV-Ray in order to make for consistent testing. In most circumstances, POV-Ray seems to push the CPU harder than our Prime95 test ever did, drawing more power. As we cannot adjust the number of threads on POV-Ray, we discovered that through the command line, we can set an affinity mask and limit exactly which cores the program can use.
We go into detail about how to set an affinity mask in our 2990WX CPU0 follow-up article. You can read about it at this link.
In this case, we can select which cores get the POV-Ray threads, and the threads cannot jump to other cores. So as long as the CPU has enumerated the cores appropriately, we can control crossing die boundaries very easily.
The way we gather data is still the same – taking the internal register values for power. This is one of the simplest ways to take power, and is actually the way the system itself determines power limits for reducing clock speeds or reacting to other system stimuli. It is a rough estimate, somewhere within 10% of the real value according to power experts, and may not be as accurate as physical testing, however it has the advantage of giving more data, and in a way that is easily accessible without additional hardware or set up time. With the method we use, we accept those risks and the possibility of variance from real values, however we have confidence that as the CPU uses these values for its own internal metrics, they should also be good enough for us as well.
Another change is in our definitions. Previously we separated the package power into ‘Core’ and ‘Uncore’ (or interconnect, such as Infinity Fabric). AMD’s internal registers actually give the values for total package and per-core power, meaning that the difference between the two values is not only the uncore, but also the IO and the DRAM controllers too. Some Intel chips actually partition out the DRAM and Uncore, however AMD does not, so we have to accept that the number we get is an amalgamation of these values. However, based on the test, the IO and DRAM should be a constant value. But for the sake of clarity, instead of labelling the value ‘Uncore’, it is now labelled ‘non-Core’.
For this update, we re-ran every Threadripper 2 processor with the new test to find the data.
Starting at the Top: 32-Core Threadripper 2990WX
The key stats on the 2990WX is the 32 core design, with a 250W TDP. From our POV-Ray testing, we hit that 250W around 20 cores loaded.
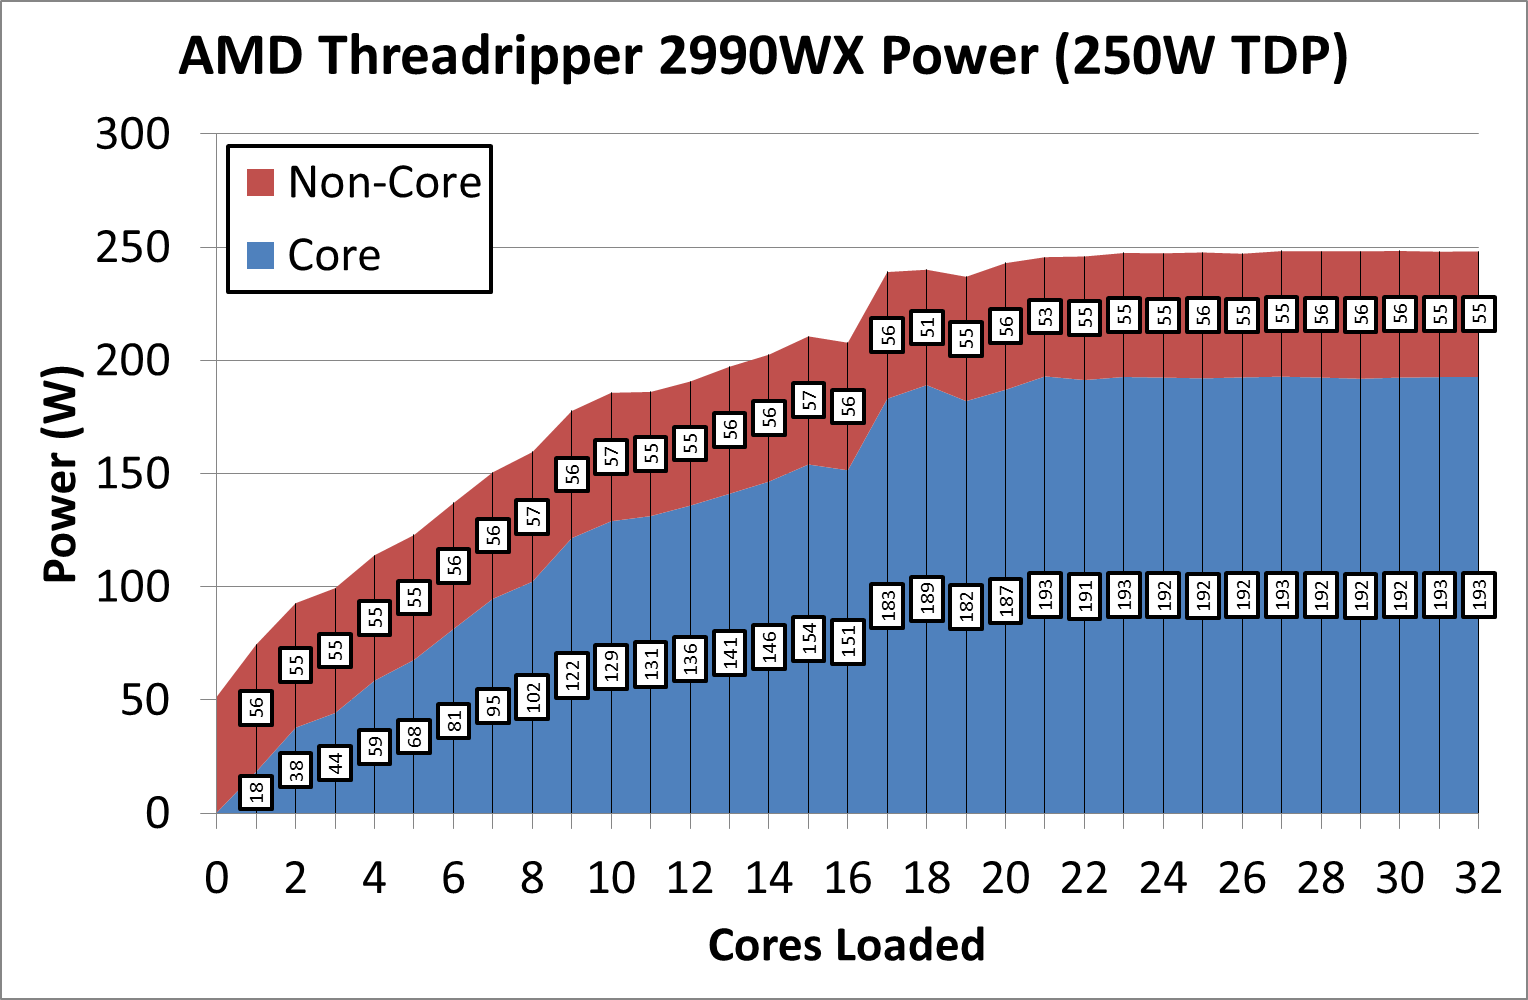
It is worth noting that we see a couple of bumps around 10 cores and 18 cores. If we split out the per-core values, we can see that actually the per-core power goes up for these settings.
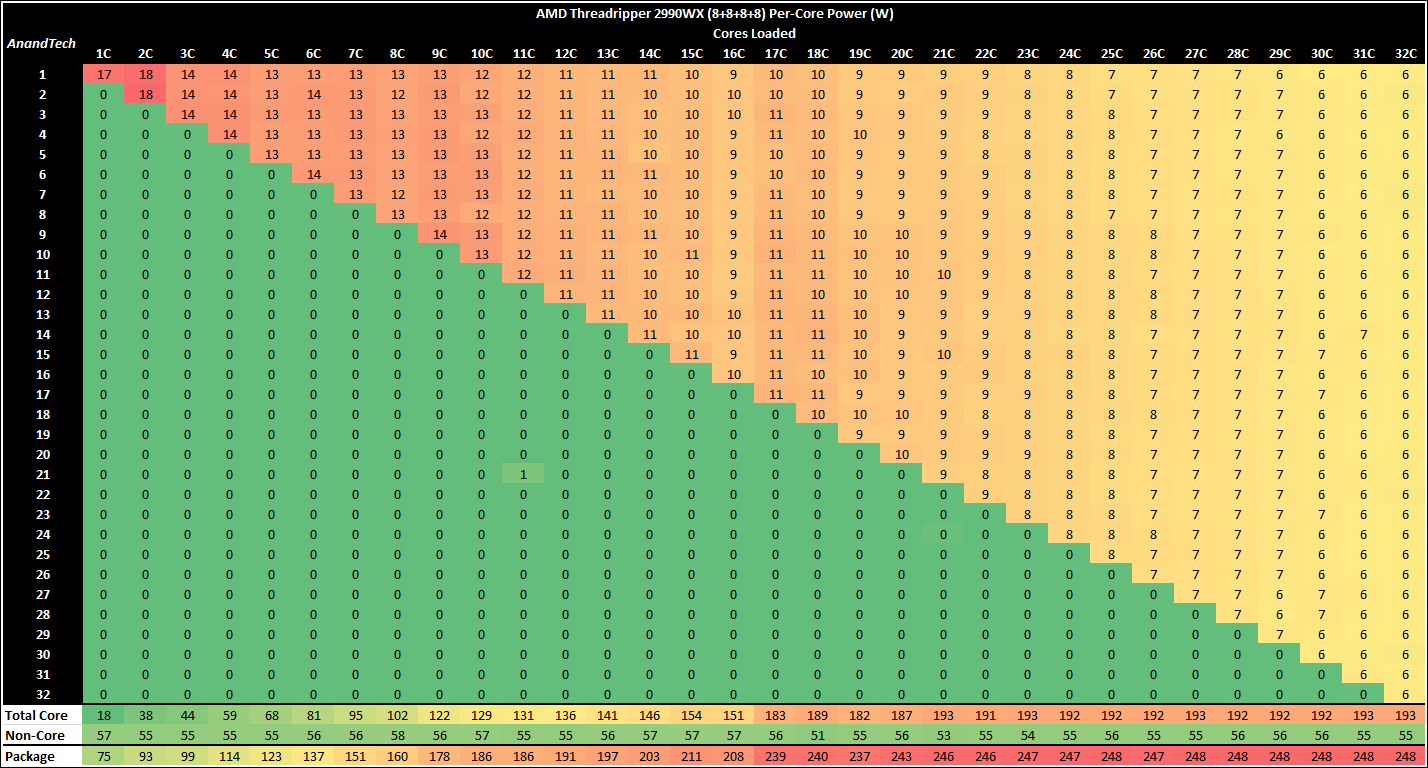
The easiest difference to see is at the 16C level, where each core gets on average 9W and then goes up to 10W, despite more load being added. This is because we are crossing die boundaries, and as new threads are being enabled further away from where the others are, it allows more power to be pushed through without disrupting temperatures too much.
The 24-Core Setup: Threadripper 2970WX
Moving down to 24-cores, each of the four silicon dies now has six cores rather than eight, which means we cross those die boundaries earlier. This has benefits and issues worth mentioning.
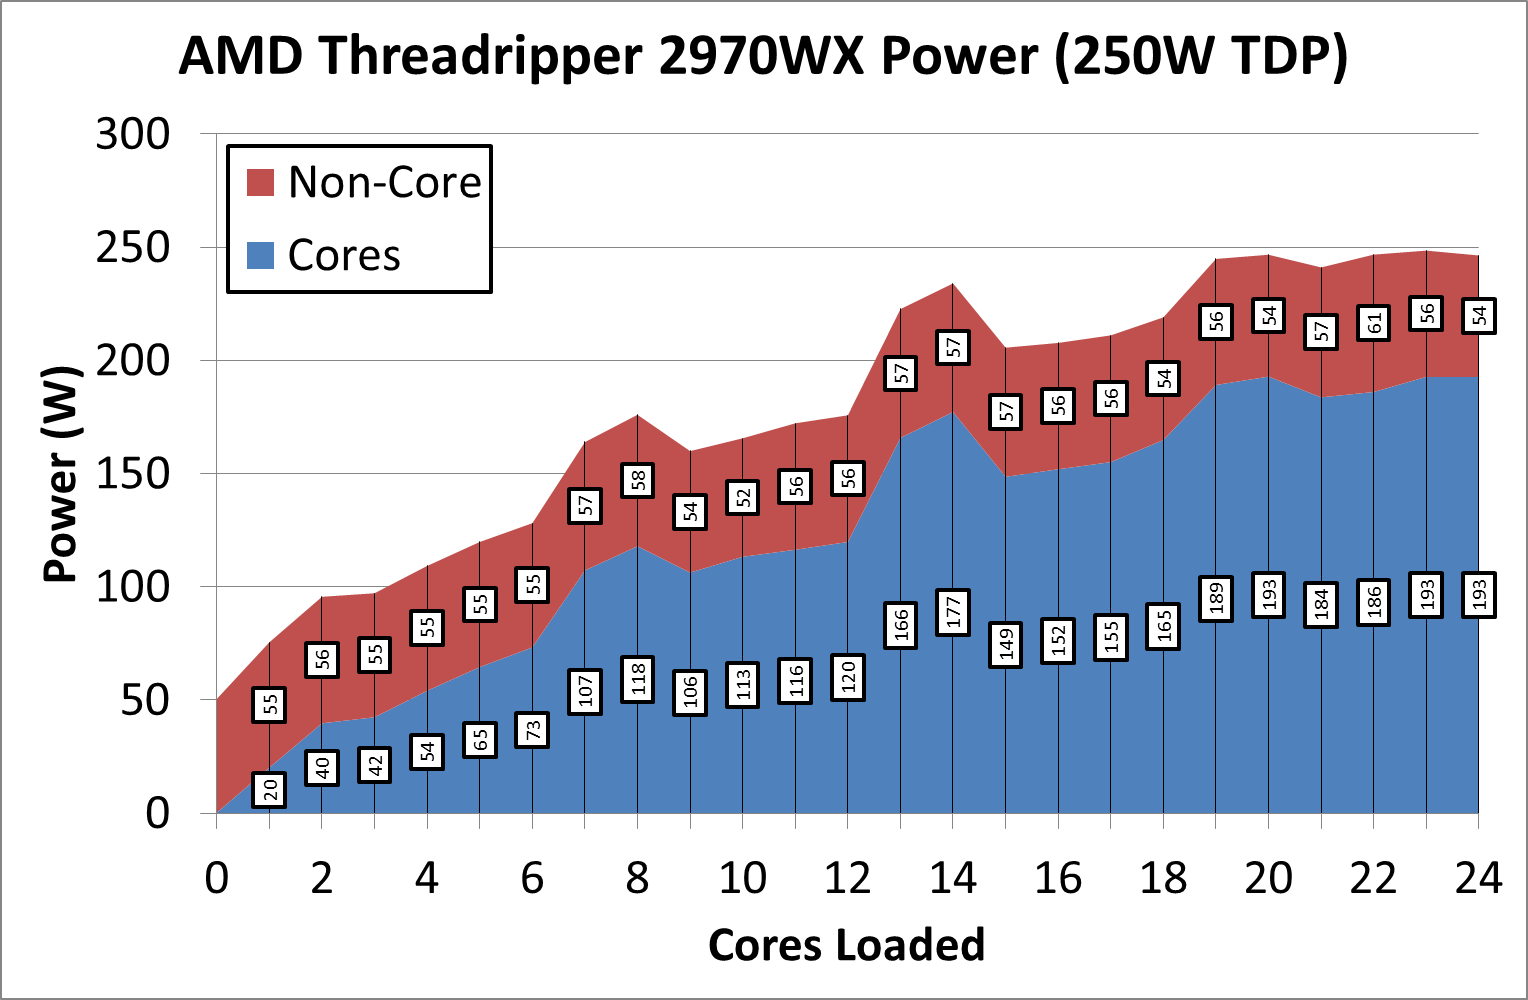
Now this graph is not as linear as I was expecting. We see big rises at 7-8 core load, 13-14 core load, and 19-20 core load. The reason is the same as the 2990WX: we are crossing die boundaries when more threads are added.
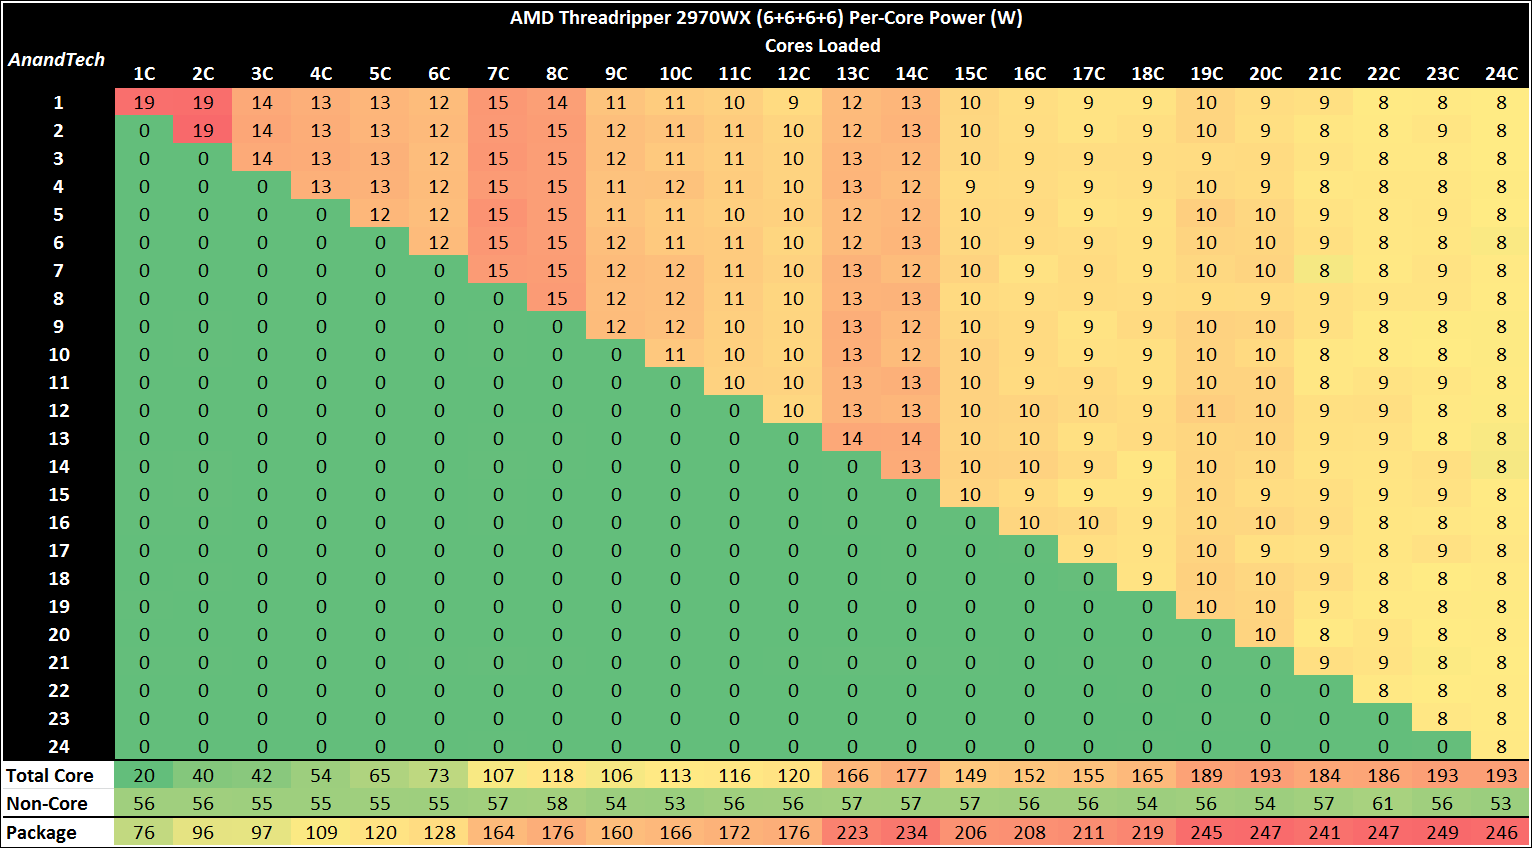
In the per-core charts, this is much easier to see. At the first boundary at 7-8 core load, we go from 12W per core to 15W per core. At the second boundary at 13-14 core load, we go from 10W per core to 12-13W per core. The downside of this is that going past this initial two-core high actually causes a drop in power consumption in order to counteract placing more threads on the same die.
In both the 2970WX and 2990WX, the ‘non-core’ power was around 53-55W of the total package power, even at low loads. This is roughly 20-22% of the total package power. Keep that number for later.
The Previous Recommendation: 16-Core Threadripper 2950X
With only one silicon boundary, we should expect the 2950X to be a reasonably sedate affair. This chip has a maximum TDP of 180W, and fewer IF links to draw power from the total package.
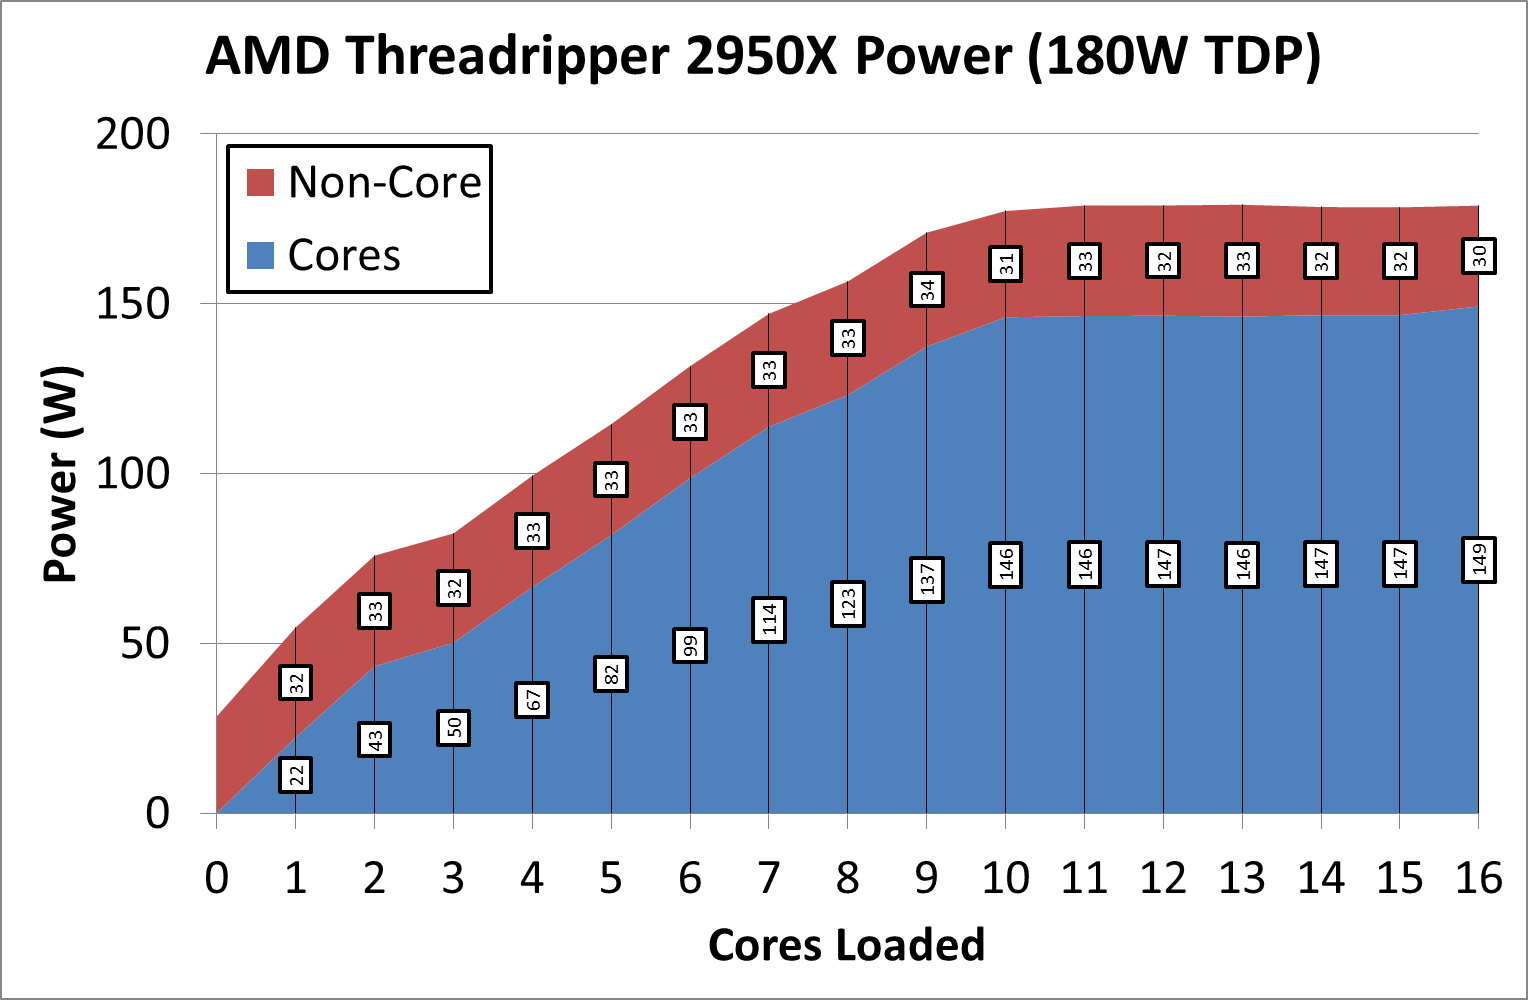
The 2950X power curve under POV-Ray is relatively smooth, and we top out at that 180W TDP value at around 10 cores loaded.
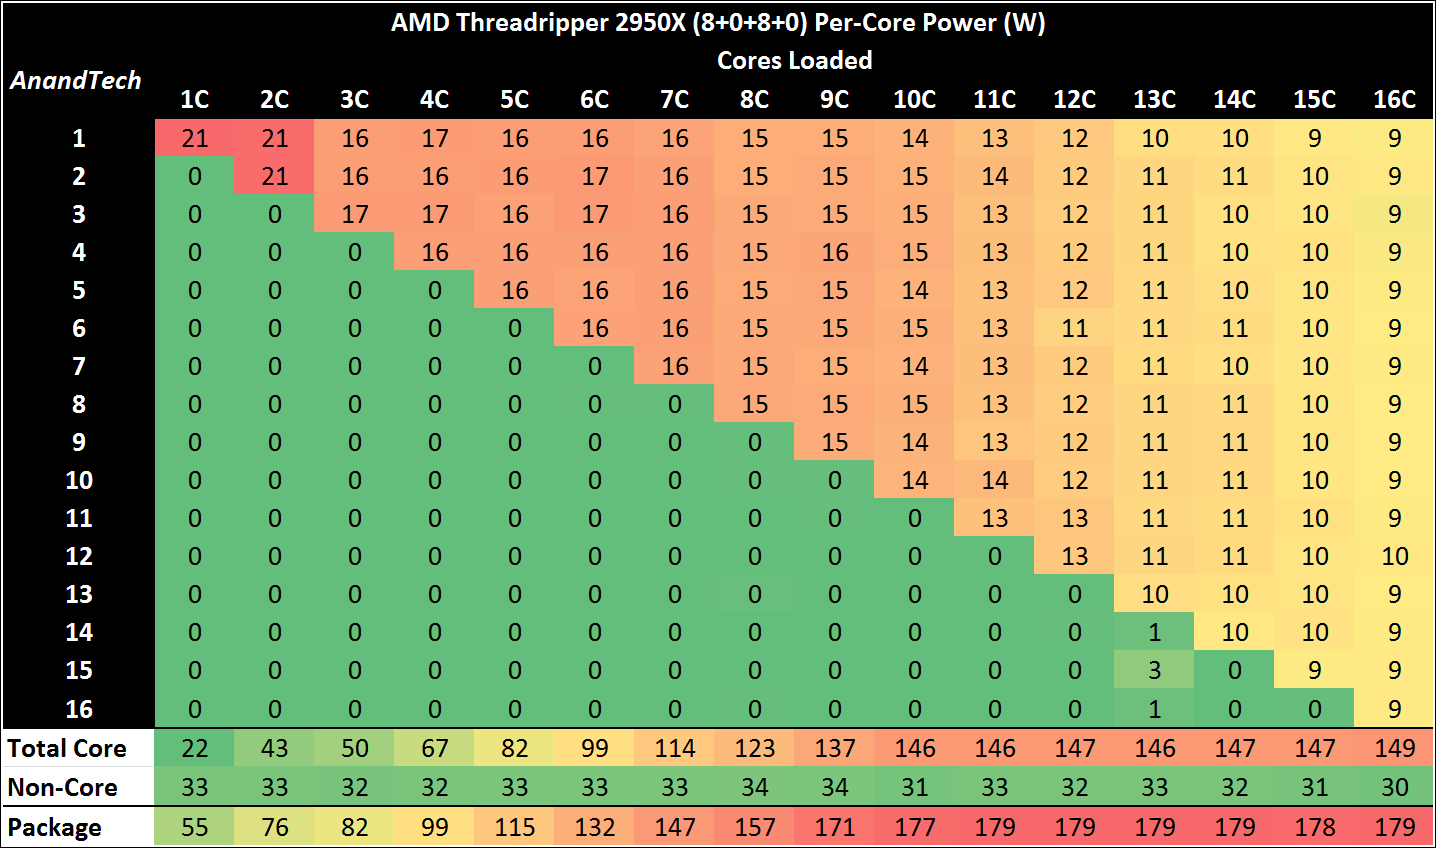
There are no surprises on the per-core values, except that in 1-2 core mode we actually push 21W through those Zen+ cores, compared to 6W per core when the 2990WX is fully loaded. That’s a large range in which the core has to be both efficient and performant.
The 12-Core Backup: Threadripper 2920X
A few years ago, offering a 12-core CPU on a consumer platform would have been a dream come true. It seems odd these days that the lowest CPU in this test is a 12-core. But here we are.
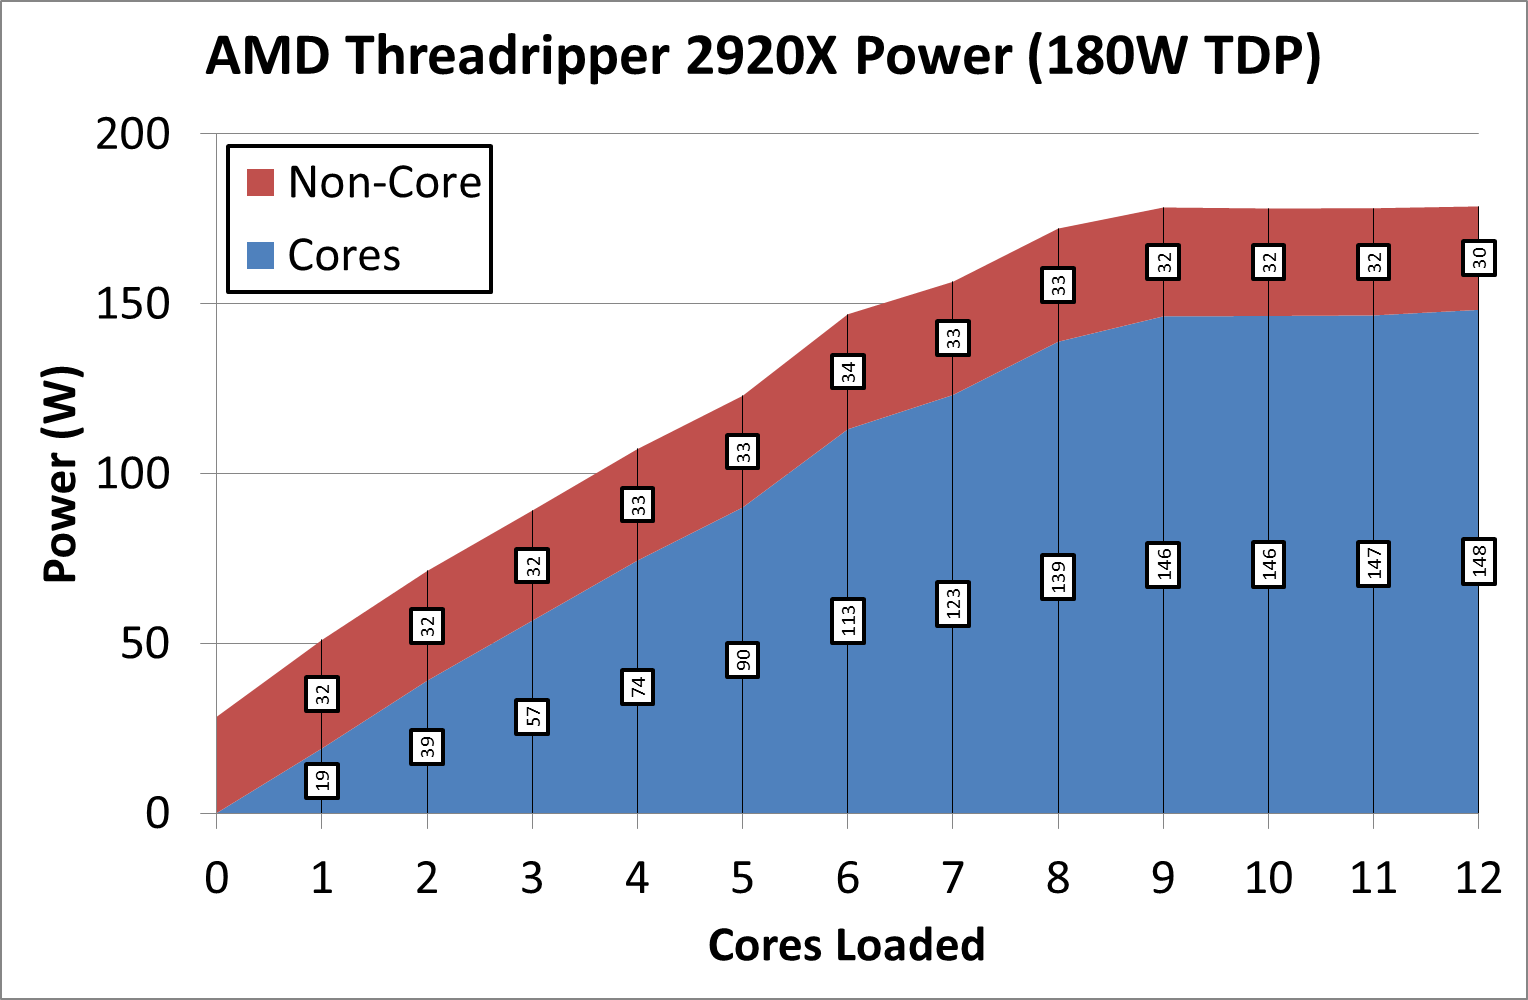
Similar to the 2950X, the power curve is smooth and regular, and we again hit the 180W TDP around 9-10 core load. This time we really need to use all the chip to get to the top power levels.
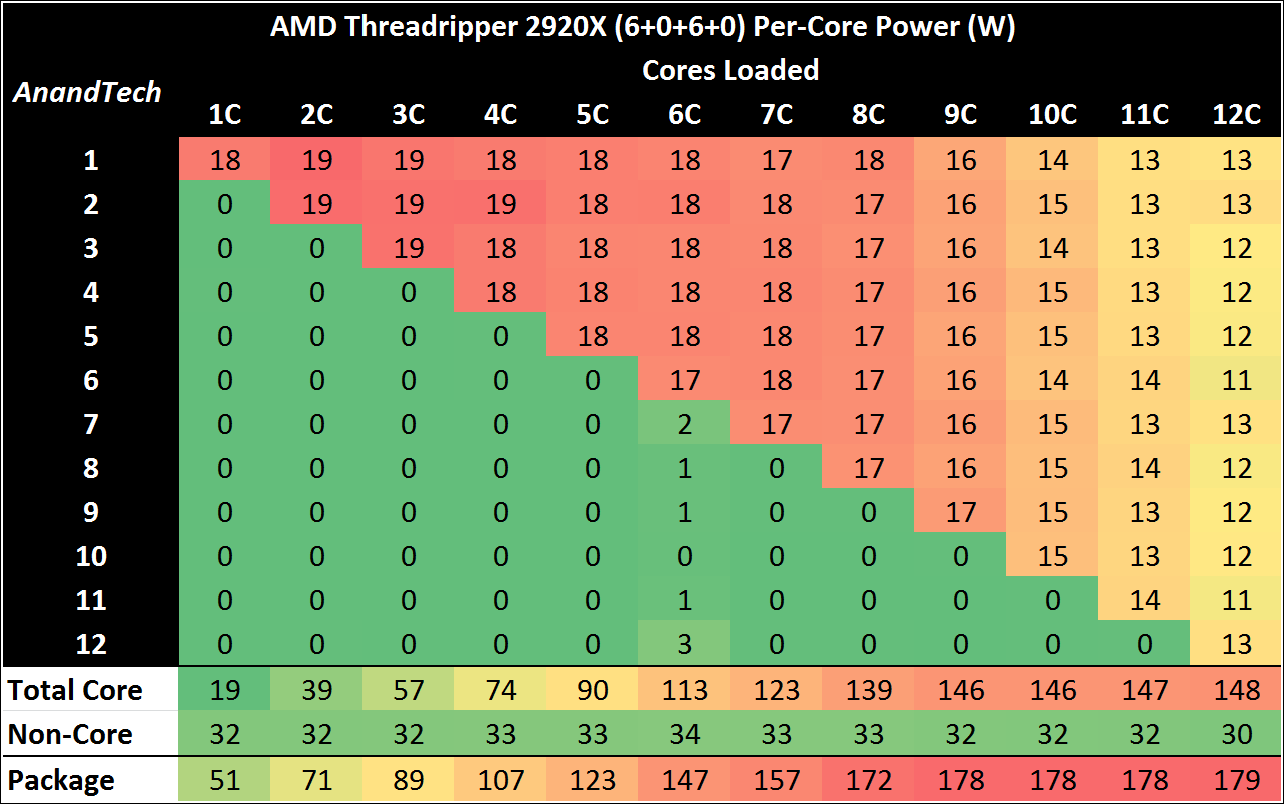
What is interesting about the per-core values for the 2920X is that it isn’t until 8C fully loaded that we actually see a proper per-core power drop – at one core load, that core is drawing 18W, and at 7C load, the cores are still drawing 17-18W each. That’s a good environment for keeping frequencies high, as I’m sure we’ll see in some of the benchmarks.
Going back to the non-core power, on these last two chips, we see the non-core power around 30W, which is only 16-17% of the total CPU power when fully loaded. This is just over half the power of the quad-die processors, mainly because of fewer Infinity Fabric links.
Peak Power Comparison
So for our peak power comparison tests, we take the peak full package power value from our per-core testing. Again we are using POV-Ray as our load generator.
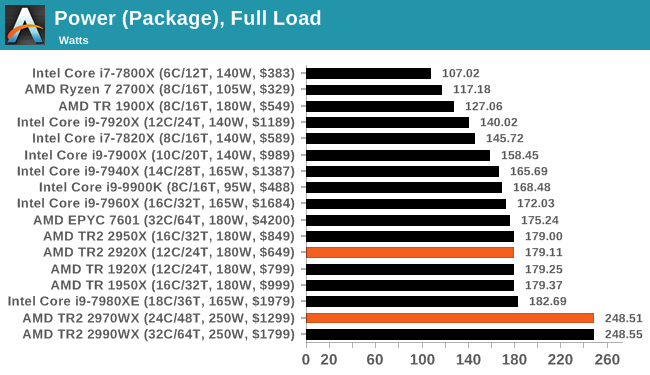
All the TR2 processors stay within TDP in our testing, but this is down to how AMD defines its TDP.


69 Comments
View All Comments
peevee - Monday, October 29, 2018 - link
You don't have real workstation tests except for Chromium compile, and even that is apparently broken (for example, no /Gm on the projects or something like that).Schmich - Monday, October 29, 2018 - link
Your ads are one of the worst of tech blogs. Distracting ads with moving items. Dynamic resizing of the slow loading header ads, so by the time you want to click on something you've clicked on something else. Autoplaying videos that follow you down as you read the article. No wonder people install adblock but strangely blogs call the readers a problem.peevee - Wednesday, October 31, 2018 - link
Somebody reading anandtech who does not use adblocking?I am genuineley shocked.
And it's not a blog.
firestream - Monday, October 29, 2018 - link
Can someone test the those in-memory business application like Qlikview? It should be very interesting whether TR2 can replace the developer machine who are crunching large amount of dataset to build dashboard or analytic.crotach - Tuesday, October 30, 2018 - link
Damn, this i9-9900k is a beast! It even looks like good value for money when compared like this.SanX - Wednesday, October 31, 2018 - link
What the problem with AMD AVX or test's AVX?GreenReaper - Wednesday, October 31, 2018 - link
AMD's AVX units are limited due to the Zen architecture. Basically, they cut stuff down into 128-bit chunks but only certain modules can do certain things. AVX2 requires work over two instructions. And it can't do AVX-512 yet. This might well have been the appropriate decision - after all, wider units means more to go wrong, and more power. But it limits performance on AVX workloads.Henk Poley - Saturday, November 10, 2018 - link
I wonder when they'll include a few high performance cores for single core heavy tasks. Kinda ridiculous that an iPad Pro / iPhone XR can get +33 to +50% better performance on Speedometer 2.0Henk Poley - Saturday, November 10, 2018 - link
It could be cool to throw in a 4-core Intel Core i7-7740X, which appears to be fairly efficient in multicore performance. I wouldn't be surprised if it held up decently at the bottom spot, but using much less cores.