Gemini Lake SFF PC Showdown: Intel's June Canyon (NUC7PJYH) and ECS's LIVA Z2 Reviewed
by Ganesh T S on December 20, 2018 8:00 AM ESTUL Benchmarks - PCMark and 3DMark
This section deals with a selection of the UL Futuremark benchmarks - PCMark 10, PCMark 8, and 3DMark. While the first two evaluate the system as a whole, 3DMark focuses on the graphics capabilities.
PCMark 10
UL's PCMark 10 evaluates computing systems for various usage scenarios (generic / essential tasks such as web browsing and starting up applications, productivity tasks such as editing spreadsheets and documents, gaming, and digital content creation). We benchmarked select PCs with the PCMark 10 Extended profile and recorded the scores for various scenarios. These scores are heavily influenced by the CPU and GPU in the system, though the RAM and storage device also play a part. The power plan was set to Balanced for all the PCs while processing the PCMark 10 benchmark.
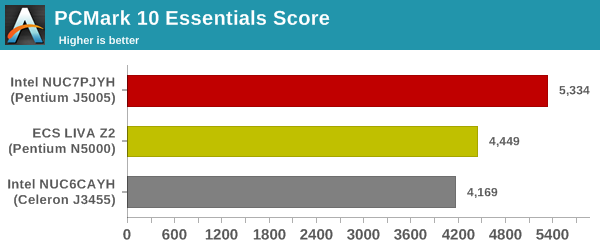
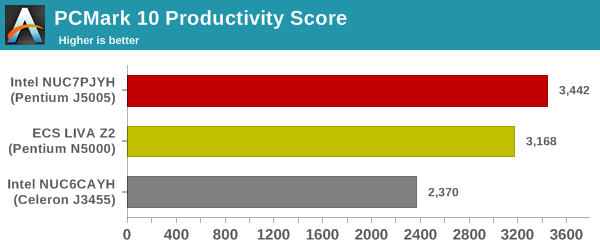
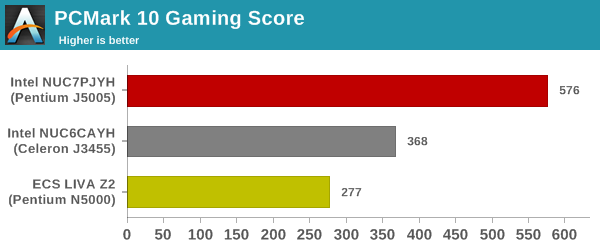
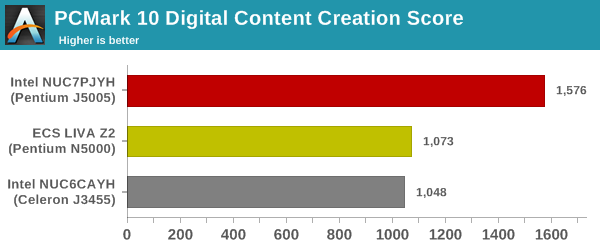
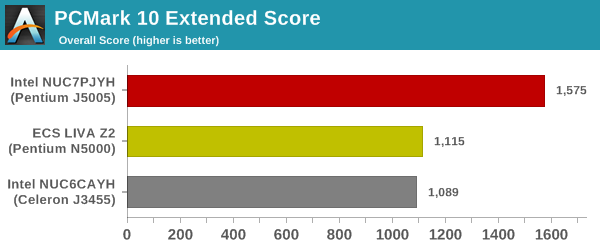
Other than the gaming scenario, the passively-cooled ECS LIVA Z2 turns out to be better than the Arches Canyon NUC. The June Canyon NUC comes out on by a huge margin.
PCMark 8
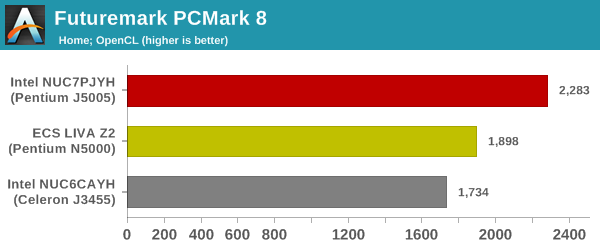
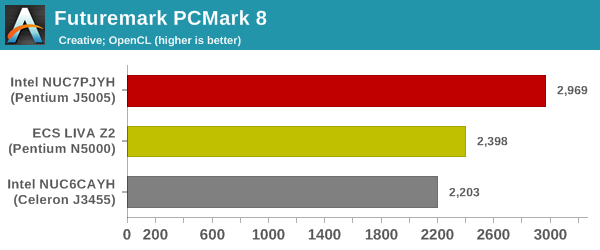
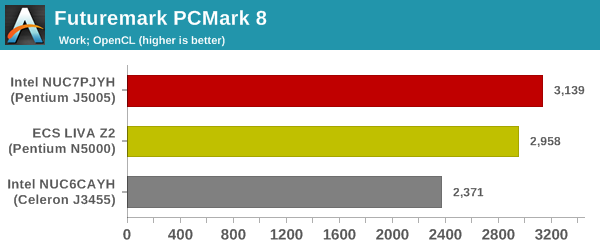
We continue to present PCMark 8 benchmark results (as those have more comparison points) while our PCMark 10 scores database for systems grows in size. PCMark 8 provides various usage scenarios (home, creative and work) and offers ways to benchmark both baseline (CPU-only) as well as OpenCL accelerated (CPU + GPU) performance. We benchmarked select PCs for the OpenCL accelerated performance in all three usage scenarios. These scores are heavily influenced by the CPU in the system. Despite its passive cooling, the ECS LIVA Z2 is a step ahead of the Arches Canyon NUC in all the workloads.
3DMark
UL's 3DMark comes with a diverse set of graphics workloads that target different Direct3D feature levels. Correspondingly, the rendering resolutions are also different. We use 3DMark 2.4.4264 to get an idea of the graphics capabilities of the system. In this section, we take a look at the performance of the Gemini Lake UCFF PCs across the different 3DMark workloads.
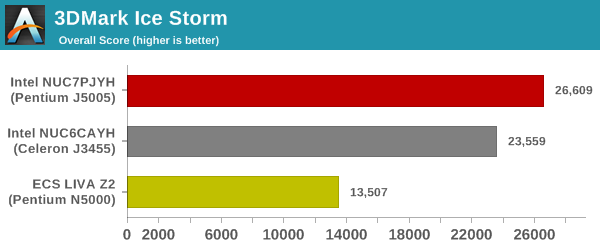
3DMark Ice Storm
This workload has three levels of varying complexity - the vanilla Ice Storm, Ice Storm Unlimited, and Ice Storm Extreme. It is a cross-platform benchmark (which means that the scores can be compared across different tablets and smartphones as well). All three use DirectX 11 (feature level 9) / OpenGL ES 2.0. While the Extreme renders at 1920 x 1080, the other two render at 1280 x 720. The graphs below present the various Ice Storm worloads' numbers for different systems that we have evaluated.
| UL 3DMark - Ice Storm Workloads | |||
3DMark Cloud Gate
The Cloud Gate workload is meant for notebooks and typical home PCs, and uses DirectX 11 (feature level 10) to render frames at 1280 x 720. The graph below presents the overall score for the workload across all the systems that are being compared.

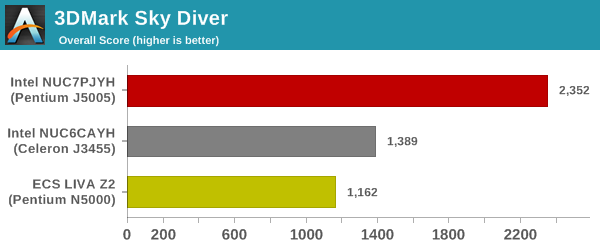
3DMark Sky Diver
The Sky Diver workload is meant for gaming notebooks and mid-range PCs, and uses DirectX 11 (feature level 11) to render frames at 1920 x 1080. The graph below presents the overall score for the workload across all the systems that are being compared.
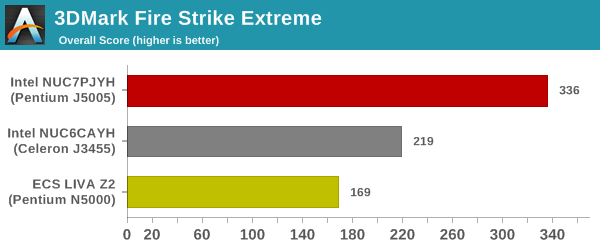
3DMark Fire Strike Extreme
The Fire Strike benchmark has three workloads. The base version is meant for high-performance gaming PCs. Similar to Sky Diver, it uses DirectX 11 (feature level 11) to render frames at 1920 x 1080. The Ultra version targets 4K gaming system, and renders at 3840 x 2160. However, we only deal with the Extreme version in our benchmarking - It renders at 2560 x 1440, and targets multi-GPU systems and overclocked PCs. The graph below presents the overall score for the Fire Strike Extreme benchmark across all the systems that are being compared.
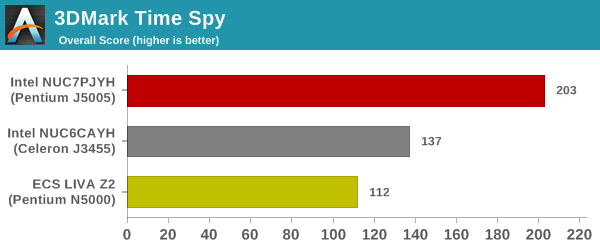
3DMark Time Spy
The Time Spy workload has two levels with different complexities. Both use DirectX 12 (feature level 11). However, the plain version targets high-performance gaming PCs with a 2560 x 1440 render resolution, while the Extreme version renders at 3840 x 2160 resolution. The graphs below present both numbers for all the systems that are being compared in this review.
| UL 3DMark - Time Spy Workloads | |||
3DMark Night Raid
The Night Raid workload is a DirectX 12 benchmark test. It is less demanding than Time Spy, and is optimized for integrated graphics. The graph below presents the overall score in this workload for different system configurations.
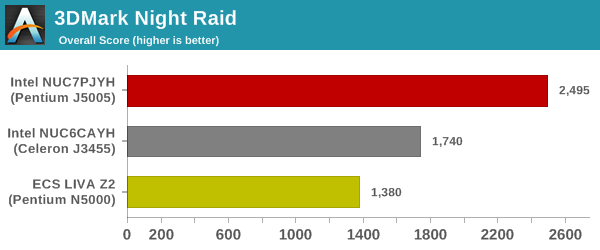
In terms of GPU performance, being actively cooled helps the Arches Canyon NUC come in second place for almost all relevant cases


59 Comments
View All Comments
mode_13h - Friday, December 21, 2018 - link
I think the main reason for Intel doubling last-level cache vs. Apollo Lake is all the cheapo systems using this in single-channel mode.IntelUser2000 - Thursday, December 20, 2018 - link
"Doubling the internal cache has led to significant performance increase in many real-life workloads."Come on. It's not due to cache. Goldmont Plus cores in Gemini Lake has substantial architectural improvements. Doubled caches are usually responsible for maybe 5% increase in performance.
shelbystripes - Friday, December 21, 2018 - link
Ummm... that’s not really a valid assumption. Sure, if the system already has enough cache, adding more cache will not substantially increase performance.But the cache size is actually small enough to restrain performance (which can happen with these smaller, lower-cost parts). The “doubling” here is going from 2MB to 4MB L2 cache, which for the quad-core designs compared here, means effectively from 0.5MB per core to 1MB of L2 cache per core.
That sounds like a lot of L2 cache, until you realize there’s no L3 cache. That’s it, 0.5-1MB per core of last-level cache, and then you’re going to system RAM.
Is there even an Intel Core CPU made today with only 0.5MB of last level cache? Those tend to have only 256KB of L2, but then at least 1MB of L3 per core. That’s enough cache that adding more cache won’t help you much. Given the smaller, simpler design of Atom, I’m not surprised going up to 1MB of L2 cache per core would yield substantial performance benefits.
Brunnis - Friday, December 21, 2018 - link
Goldmont Plus has substantial architectual enhancements that are much more likely to account for the lion’s share of the performance increase. The article makes it seem Goldmont Plus is mainly about larger L2, which is a bit misleading. See this link:https://en.wikichip.org/wiki/intel/microarchitectu...
Brunnis - Friday, December 21, 2018 - link
Even smaller compute heavy benchmarks perform 20-30% faster, which is usually not the case for a mere L2 size increase (I’ve never seen that, at least).mode_13h - Friday, December 21, 2018 - link
The performance impact of cache is highly workload-dependent. However, it does sound like there are some significant improvements:https://en.wikichip.org/wiki/goldmont_plus#Key_cha...
Smell This - Thursday, December 20, 2018 - link
So ...How many tens of billions of dollars has Chipzilla spent subsidizing the 'Next Units' and Atom 'Fails'?
The 'new' NUCs are not, really, all that. An AMD Ryzen V1000 SoC mini-ITX FP5 BGA at 12/14nm would 'Temash' the Atom at 10-12w.
ZOLTAC ... make it so.
Death666Angel - Thursday, December 20, 2018 - link
I'd take some more AM4 mSTX motherboards. There are quite a few Intel ones, but the beefier iGPU for AMD would make for a more well rounded system.Alien88 - Saturday, December 22, 2018 - link
Check out the Udoo Bolt...LMonty - Friday, December 21, 2018 - link
Hello Ganesh, could you pls. confirm whether the NUC operates in dual channel mode when using 32GB of RAM? I saw one review on Amazon complaining that his J5005 NUC was running in single channel mode, when using 2x8GB sticks (16GB total).