The GIGABYTE Aorus RGB M.2 SSD Review: Nothing Is Too Small For RGB LEDs
by Billy Tallis on April 10, 2019 8:00 AM ESTWhole-Drive Fill
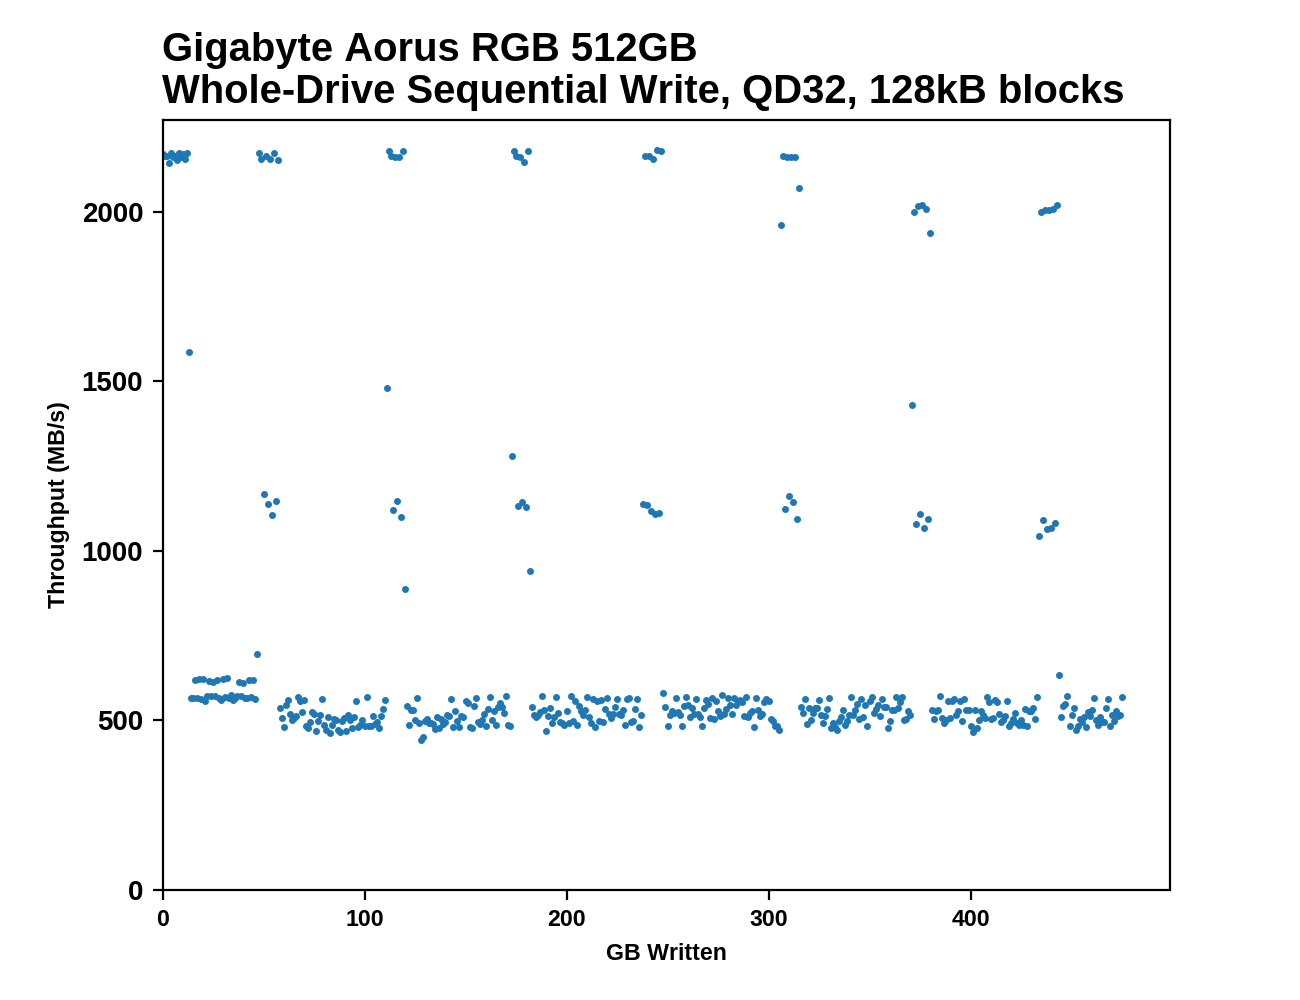
This test starts with a freshly-erased drive and fills it with 128kB sequential writes at queue depth 32, recording the write speed for each 1GB segment. This test is not representative of any ordinary client/consumer usage pattern, but it does allow us to observe transitions in the drive's behavior as it fills up. This can allow us to estimate the size of any SLC write cache, and get a sense for how much performance remains on the rare occasions where real-world usage keeps writing data after filling the cache.
 |
|||||||||
The GIGABYTE Aorus RGB SSDs show the same general behavior as other Phison E12 drives during a drive fill operation. The SLC cache keeps write speeds high for the first few GB, then the drive drops down to a much lower speed. The SLC write cache is periodically emptied, giving brief bursts back up to full speed, or nearly so. The smaller drives show longer garbage collection cycles than the 1TB models we've previously looked at, and combined with their smaller capacity this means that there are far fewer high-speed bursts while filling the 256GB model than a 1TB drive.
Both peak and baseline write performance scale with drive capacity, though the 256GB model's baseline performance is a bit better than a linear trend would predict.
The initial SLC write cache sizes appear to be about 7GB for the 256GB model and about 13GB for the 512GB model, compared to about 20GB for the 1TB Silicon Power P34A80.
 |
|||||||||
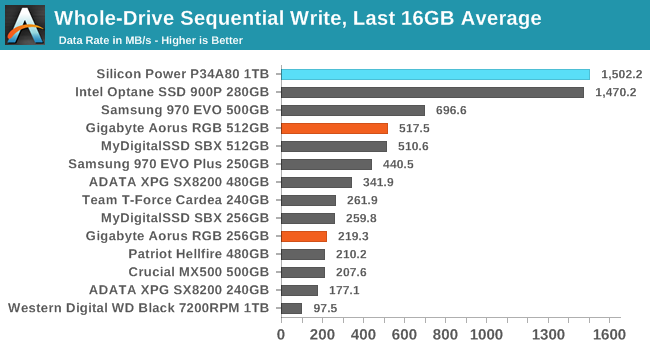
| Average Throughput for last 16 GB | Overall Average Throughput | ||||||||
The long-term sustained write speeds from the Aorus SSDs are reasonable for their respective capacity classes. The 512GB model is about 15% slower than the Samsung 970 EVO but outperforms the ADATA SX8200, while the 256GB model trails its Samsung competitor by a bit more still stays ahead of the SX8200 and the entry-level NVMe drive.
BAPCo SYSmark 2018
BAPCo's SYSmark 2018 is an application-based benchmark that uses real-world applications to replay usage patterns of business users, with subscores for productivity, creativity and responsiveness. Scores represnt overall system performance and are calibrated against a reference system that is defined to score 1000 in each of the scenarios. A score of, say, 2000, would imply that the system under test is twice as fast as the reference system.
SYSmark scores are based on total application response time as seen by the user, including not only storage latency but time spent by the processor. This means there's a limit to how much a storage improvement could possibly increase scores, because the SSD is only in use for a small fraction of the total test duration. This is a significant difference from our ATSB tests where only the storage portion of the workload is replicated and disk idle times are cut short to a maximum of 25ms.
| AnandTech SYSmark SSD Testbed | |
| CPU | Intel Core i5-7400 |
| Motherboard | ASUS PRIME Z270-A |
| Chipset | Intel Z270 |
| Memory | 2x 4GB DDR4-2666 CL15 |
| Case | In Win C583 |
| Power Supply | Cooler Master G550M |
| OS | Windows 10 64-bit, version 1803 |
Our SSD testing with SYSmark uses a different test system than the rest of our SSD tests. This machine is set up to measure total system power consumption rather than just the drive's power.
 |
|||||||||
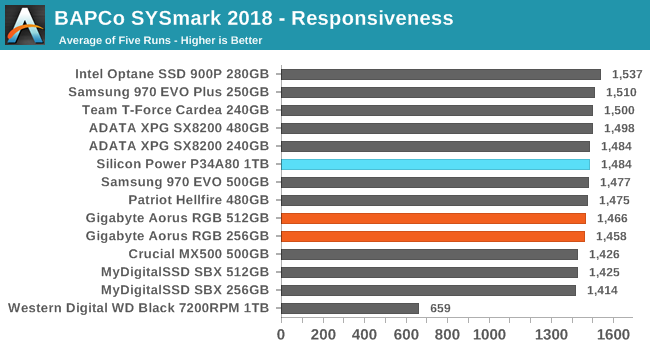
| Creativity | Productivity | Responsiveness | Overall | ||||||
The SYSmark Responsiveness scores for the Aorus SSDs are a small step up from the Crucial MX500 SATA SSD or the MyDigitalSSD SBX entry-level NVMe drive, but the Aorus doesn't outperform any other high-end NVMe drives. The Creativity and Productivity scores show almost no difference between the SSDs in this batch, and consequently the Overall scores are also closer together than the Responsiveness scores.
Energy Usage
The SYSmark energy usage scores measure total system power consumption, excluding the display. Our SYSmark test system idles at around 26 W and peaks at over 60 W measured at the wall during the benchmark run. SATA SSDs seldom exceed 5 W and idle at a fraction of a watt, and the SSDs spend most of the test idle. This means the energy usage scores will inevitably be very close. A typical notebook system will tend to be better optimized for power efficiency than this desktop system, so the SSD would account for a much larger portion of the total and the score difference between SSDs would be more noticeable.
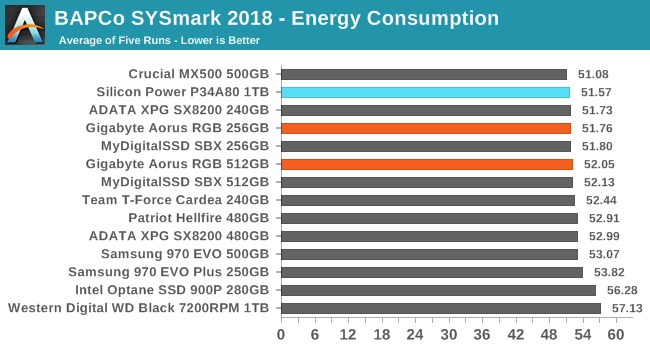
The Aorus SSDs have relatively good energy consumption scores for the SYSmark test, though not quite as good as the Crucial MX500 SATA SSD. The Silicon Power P34A80 unsurprisingly uses a bit less energy than the Aorus since it is based on the same controller but with enough capacity to reach its full performance potential, and it lacks the LEDs that the Aorus SSDs have. The Samsung 970s are relatively power-hungry for M.2 drives.


23 Comments
View All Comments
clegmir - Tuesday, April 30, 2019 - link
Have there been any issues with the heat of the LEDs causing drive performance or unresponsiveness? I saw some frightening things about the HyperX Fury RGB SSD on YouTube.anjilikawalson - Monday, July 22, 2019 - link
One of the best review of gigabyte. More often, if you want any tips for AOL Password Recovery you can visit http://www.aolhelp247.com/aol-password-recovery/ for 24/7 help.vrssoftware - Wednesday, August 7, 2019 - link
How to Buy Retail Software?https://www.vrssoftwares.com/retail-software/