Test Driving SPECviewperf 2020: A Look At The Latest In Workstation GPU Benchmarks
by Ganesh T S on October 16, 2020 11:00 AM EST- Posted in
- GPUs
- Systems
- Benchmarks
- SPEC
- SPECviewperf
- SPECgpc
Over the years, the Standard Performance Evaluation Corporation's SPECviewperf benchmark has become the industry standard for workstation GPU benchmarking. Owing to the fact that, unlike video games, there's little concept of a "standard" workload for CAD, content creation, and visual data analysis tools, as well as the sheer complexity of these applications, there is an ongoing need for a standardized multi-application benchmark. This is both to offer a wider, holistic view of GPU performance under workstation applications, and even more fundamental than that, to provide a proper apples-to-apples testing environment.
With updates to the workstation applications used to generate the traces in SPECviewperf 13, the benchmark has been due for a refresh – and that has finally arrived this week with the release of SPECviewperf 2020. An incremental update over SPECviewperf 13, the 2020 version makes some important changes including support for 4K resolutions, as well as updating the workload traces.
Meanwhile, with a few systems already setup for other needs, we decided to take a quick test drive of the new version of the SPECviewperf, giving us a better look at what's new along with an idea of where performance lies with the updated benchmark workloads.
SPECviewperf 2020: What's New
SPECviewperf 13 has been a component in many of our system reviews - particularly on ones with a discrete GPU that target both the gaming and professional / content creation markets. The new version of the benchmark, SPECviewperf 2020, brings along the following updates:
- Removal of the Showcase trace (showcase-02 viewset) from the suite (Autodesk no longer provides support for the application)
- Updated traces using latest versions of the applications (3D Studio Max, Catia, Maya, and Solidworks)
- Updated models in select viewsets (3dsmax-07, catia-06, creo-03, medical-03, and solidworks-05)
- All viewsets capable of being processed at both 1080p and 4K resolutions (SPECviewperf 13's 3ds Max and Showcase viewsets were 1080p-only)
- Advisory notes on minimum amount of necessary VRAM, as well as TDR settings for systems with entry-level GPUs
There are also some updates to the user interface and benchmark results management. Command-line options are supported officially. With SPECviewperf 13, it was unofficially possible by calling the Node-WebKit executable with the appropriate options. The new launcher in SPECviewperf 2020 makes things more straightforward.
Evaluation Setup
The SPECviewperf 2020 benchmark license makes it available for free to everyone other than sellers of computers and related products. We downloaded the latest version and took it for a test drive with some of dGPU-equipped systems processed recently in our testbed.
- Skylake-based Desktop - I (Intel Core i5-6600K / NVIDIA RTX 2070) [ Review Configuration, with the ASUS Dual GeForce RTX 2070 MINI in the first PCIe x16 slot ; Denoted by SKL-DT-2070 in the graphs below ]
- Skylake-based Desktop - II (Intel Core i5-6600K / AMD Radeon RX Vega 56 nano) [ Review Configuration, with the PowerColor RX VEGA 56 8GB HBM2-NANO Edition in the first PCIe x16 slot ; Denoted by SKL-DT-RXV56 in the graphs below ]
- Intel NUC9i9QNX Kit (Ghost Canyon NUC) (Intel Core i9-9980HK / NVIDIA RTX 2070) [ Review Configuration, benchmarked with a PCIe 3.0 x8 link between the GPU and the CPU ; Denoted by GCNUC-2070 in the graphs below ]
- Intel NUC9i9QNX Kit (Ghost Canyon NUC) (Intel Core i9-9980HK / AMD Radeon RX Vega 56 nano) [ Same configuration as above, except for the replacement of the GPU ; Denoted by GCNUC-RXV56 in the graphs below ]
- MinisForum EliteMini H31G (Intel Core i5-9500F / NVIDIA GTX 1050Ti) [ Review Configuration ; Denoted by MF-H31G-1050Ti in the graphs below ]
- ASRock DeskMini Z370 GTX1060 (Intel Core i7-8700 / NVIDIA GTX 1060) [ Review Configuration ; Denoted by ASR-DM-370-1060 in the graphs below ]
The SPECviewperf 2020 workloads are meant to be processed on powerful discrete GPUs, but that doesn't preclude them from being run (sub-optimally) on integrated graphics. In order to get an idea of how the benchmark fares with iGPU solutions, we also added two top-of-the-line ultra-compact form-factor systems to the comparison points.
- Intel's Frost Canyon NUC (Intel Core i7-10710U / Intel UHD Graphics) [ Review Link, benchmarked configuration with updated storage and RAM ; Denoted by INTC-NUC10i7 in the graphs below ]
- ASRock Industrial's 4X4 BOX-4800U (AMD Ryzen 7 4800U / AMD Radeon RX Vega 8 Graphics) [ Launch Coverage, full-length review in progress ; Denoted by ASRI-4X4-4800U in the graphs below ]
The command-line interface was used to test at the two official resolutions. All viewsets were processed together (similar to the official submission candidate requirement). In some cases, one or two of the viewsets were not processed properly in the first pass - in those cases, we triggered the command again with those particular viewsets alone. On specific systems, we found that certain workloads would consistently just force quit, hang, or trigger TDR (more on this in the next section). Those generate 'null' scores or blanks in the SPECviewperf 2020 results report. The composite scores for such viewsets are set to 0 for graphing purposes. Though each model component in the viewset generates a FPS metric, only the composite scores are graphed in the section below. A link to the full results dump from the benchmark is also presented in the conclusions.
Workload Descriptions and Testing Results
SPECviewperf 2020 includes eight different workloads (viewsets) representative of graphics content and behavior of actual applications. They make use of the OpenGL 4.0 and DirectX 12 APIs under Windows. These viewsets can be run only at two desktop resolutions (1920 x 1080, and 3840 x 2160) for official submissions, and need the dsplay scaling to be set to 100% (DPI of 96). The available viewsets are listed below.
- 3ds Max (3dsmax-07)
- CATIA (catia-06)
- Creo (creo-03)
- Energy (energy-03)
- Maya (maya-06)
- Medical (medical-03)
- Siemens NX (snx-04)
- Solidworks (sw-05)
We processed SPECviewperf 2020 at both resolutions on all the system configurations listed in the previous section. The benchmark measures the frame rate at which the GPU renders the scenes in a viewset. Each viewset is composed of different scenes and rendering modes, and the composite score for the viewset is a weighted geometric mean of the FPS measured for the different scenes.
3ds Max (3dsmax-07)
The 3dsmax-06 viewset comprises of 11 different scenes. They have been created from traces of the graphics workload generated by Autodesk 3ds Max 2016 using the default Nitrous DX11 driver. Additional details are available here.
| SPECviewperf 2020: 3ds Max Composite Scores | |||
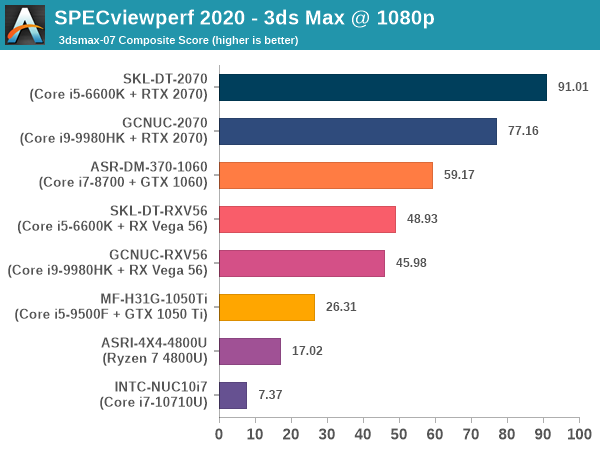
nVidia's GTX 1060 and higher-class GPUs perform better than the Radeon RX Vega 56 nano at both resolutions for the 3ds Max viewset. The 1050 Ti lags behind it, though. The PCIe 3.0 x16 configuration also offers better performance scaling for the RTX 2070 compared to a x8 link (in the SKL-DT configuration, against the GCNUC one). For the RX Vega 56, the performance difference is not as significant. On the iGPU front, AMD's Renoir iGPU offers more than double the performance of the Comet Lake-U iGPU (though consumers should not be running these types of workloads on those machines).
CATIA (catia-06)
The catia-06 viewset comprises of 8 different tests created from traces of the graphics workload generated by the CATIA V5 and 3DEXPERIENCE CATIA applications from Dassault Systemes. Additional details are available here.
| SPECviewperf 2020: CATIA Composite Scores | |||
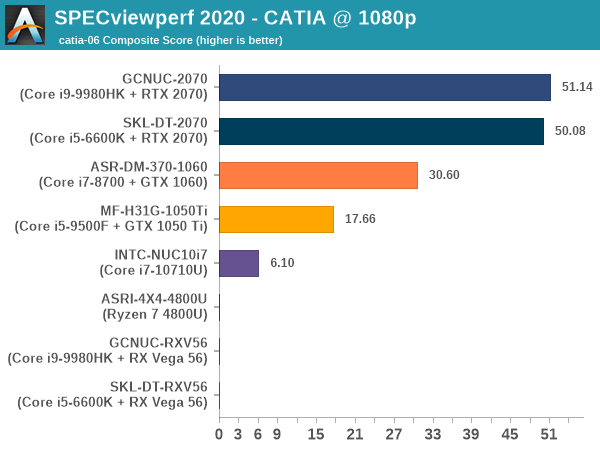
The catia-06 viewset had a consistently reproducible issue on AMD GPUs when processing the 1080p CATIA_3DX_loftJet model. TDR would keep triggering, and disabling TDR ended up with a hanging run. Hence, the 1080p scores for the three AMD GPU configurations are 0 in the above graph. Interestingly, the 4K model had no issues in getting processed correctly on all the systems. The driver version and additional configuration details are available in the generated reports linked in the final section.
Another aspect to note in the above composite scores is that the CPU capabilities seem to have more impact compared to the PCIe link-width. The Ghost Canyon NUC with its 8-core Core i9-9980HK capable of bursting higher than the 4C/4T Core i5-6600K in the SKL-DT system actually ends up at the top of the graph with a slight lead over the GCNUC configuration. This impact is also seen in the 4K results for the Radeon RX Vega 56.
Creo (creo-03)
The creo-03 viewset comprises of 13 different tests created from traces of the graphics workload generated by the Creo 4 application from PTC. Additional details are available here.
| SPECviewperf 2020: Creo Composite Scores | |||
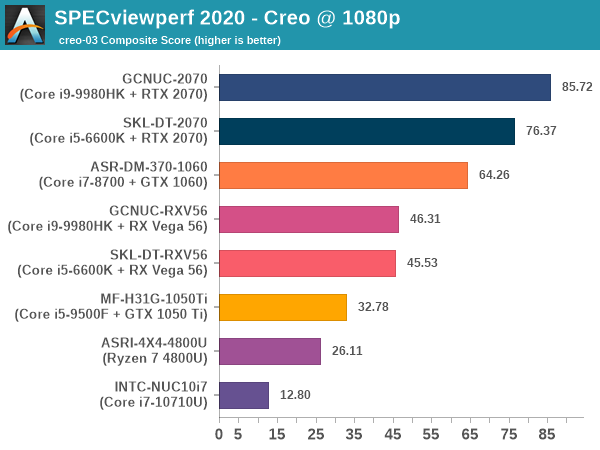
The relative ordering of the various GPUs is similar to what was seen in the 3ds Max and CATIA viewsets. Like the CATIA results, we see that the impact of the faster CPU overshadows the cutting down of the PCIe bandwidth in half for the RTX 2070. The Radeon RX Vega 56 performs similarly in both configurations.
Energy (energy-03)
The energy-03 viewset comprises of 6 different tests based on techniques used by the OpendTect seismic visualization application. It must be noted that two of the six tests require at least 1GB of frame buffer - failing that, the FPS is set to 0.01 (ensuring that the contribution to the composite score is not meaningful). Additional details are available here.
| SPECviewperf 2020: Energy Composite Scores | |||
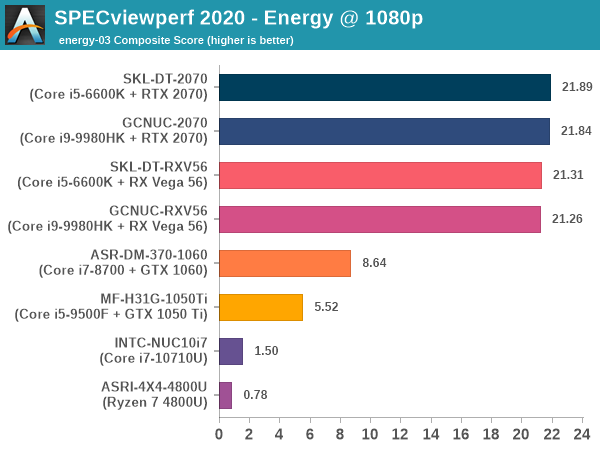
At 1080p, all four leading configurations using the RTX 2070 and the RX Vega 56 perform similarly. The minor surprise is that the CML-U iGPU performs slightly better than the Renoir's. The latter observation can also be made for the 4K resolution results. However, at that resolution, the RX Vega 56 seems to get impacted by the PCIe link bandwidth, with the performance in the x8 link of the Ghost Canyon NUC falling behind the x16 one of the Skylake desktop. The RTX 2070 seems to be GPU-limited in what it can score, with no discernible performance differences between the GCNUC and SKL-DT configurations.
Maya (maya-06)
The maya-06 viewset comprises of 10 different tests based on traces of the graphics workload generated by Autodesk Maya 2017. Additional details are available here.
| SPECviewperf 2020: Maya Composite Scores | |||
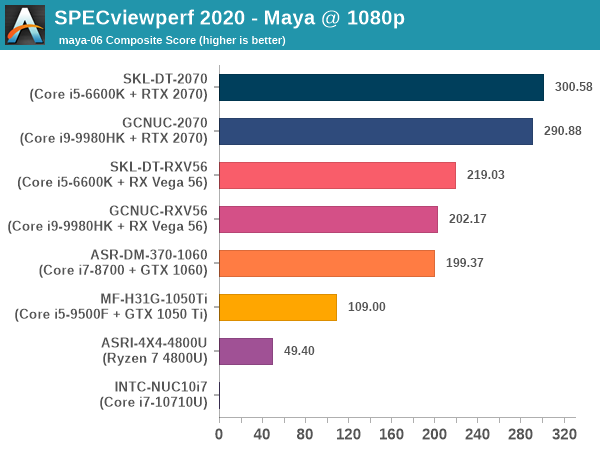
Intel's CML-U iGPU is unable to process the maya-06 viewset (force quits consistently), and hence scores 0 for both resolutions. Similar to 3ds Max, the PCIe link bandwidth seems to matter more than the CPU capabilities for Maya. The relative ordering of the performance of the various GPUs is similar to what was observed in the previous viewsets.
Medical (medical-03)
The medical-03 viewset comprises of 10 different tests derived from 5 distinct datasets. The tests use volume rendering techniques commonly adopted for medical visualization - slice rendering and ray casting. Additional details are available here.
| SPECviewperf 2020: Medical Composite Scores | |||
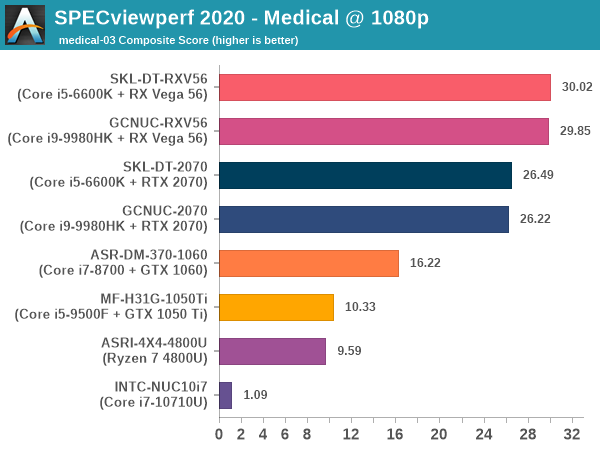
The medical-03 viewset is the first one in which the Radeon RX Vega 56 outscores the RTX 2070 by a good margin. The results do not appear to be affected adversely by halving of the PCIe link bandwidth or change in CPU capabilities, pointing to the GPU-limited nature of the workload. Building on the AMD GPUs' suitability for this workload, the iGPU in Renoir delivers 9x the performance of the CML-U version (though, again this is of academic interest only)
Siemens NX (snx-04)
The snx-04 viewset comprises of 10 tests created with traces from the graphics workload generated by the NX 8.0 application from Siemens PLM. Additional details are available here.
| SPECviewperf 2020: Siemens NX Composite Scores | |||
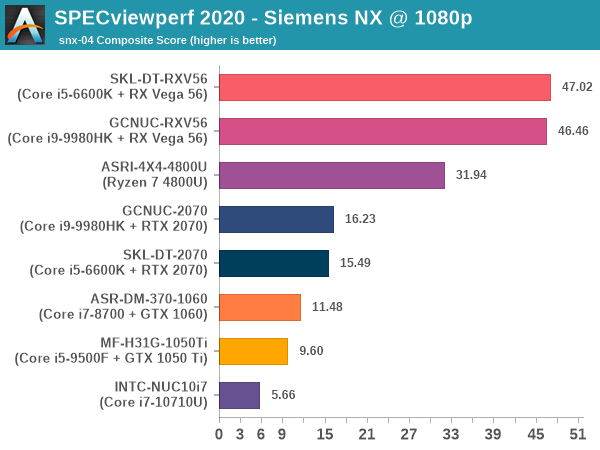
The snx-04 viewset is another one in which the AMD GPUs win big - in fact, the Renoir iGPU even outscores the mighty RTX 2070. It is possible that the features required to get the Siemens NX viewsets processed optimally are available only in the professional Quadro / ProViz GPUs from nVidia. In other observations, we see neither the PCIe link bandwidth, nor the CPU capabilities affecting the scores in a major fashion.
Solidworks (sw-05)
The sw-05 viewset comprises of 10 tests created from traces of Dassault Systemes’ SolidWorks 2020 application. A minimum of 4GB of VRAM is required for these traces, failing which the composite score is best discarded / not used to determine the performance of the Solidworks 2020 application on that machine. Additional details are available here.
| SPECviewperf 2020: Solidworks Composite Scores | |||
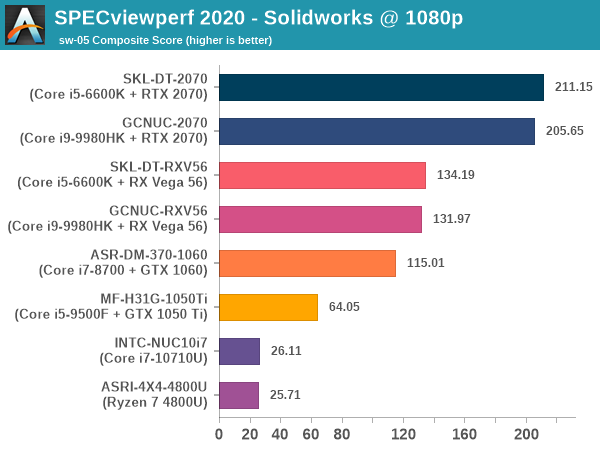
The iGPUs do not have the required 4GB frame buffers to enable the processing of the 4K version of the Solidworks viewset. Scores could be obtained for the 1080p version, though. In that, we find the CML-U and Renoir scores to be within touching distance of each other. The relative ordering of the GPUs is similar to what was seen in the first five viewsets, with the RTX 2070 scoring big over the RX Vega 56. Halving the PCIe bandwidth appears to slightly affect the scores, but the performance drop is not very significant.
Concluding Remarks
SPECviewperf 2020 has a well-built results browsing interface. In addition to the FPS values contributing to the composite score, the HTML report also has the screen grabs from the viewsets' processing. A configuration page also helps readers to get an idea of the system components and driver versions used to generate the results. The table below links to the detailed results for the graphs above.
| SPECviewperf 2020 - Test Driving Results Summary | |
| Machine Tag | Links to Results |
| SKL-DT-2070 | 1080p 2160p |
| SKL-DT-RXV56 | 1080p 2160p |
| GCNUC-2070 | 1080p 1080p (Solidworks) 2160p |
| GCNUC-RXV56 | 1080p 2160p |
| MF-H31G-1050Ti | 1080p 2160p 2160p (Solidworks) |
| ASR-DM-370-1060 | 1080p 1080p (Solidworks) 2160p |
| INTC-NUC10i7 | 1080p 2160p |
| ASRI-4X4-4800U | 1080p 2160p |
Our test drive provided interesting results with which we could analyze the effects of the PCIe link width and CPU capabilities on the performance of different viewsets. It also showed us that the benchmark could be run largely successfully even on entry-level iGPUs, though no consumer should be doing that in a business / production environment. We could have delivered more interesting results with workstation GPUs (given that their feature set and drivers are specifically tuned for these types of applications), but the consumer-focused GPUs used above were good enough for a quick look at the capabilities of the new benchmark.
SPECviewperf 2020 is an incremental update over SPECviewperf 13, but an important one - not only does it update the traces using the latest versions of the softwares from ISVs, it also allows benchmarking at 4K across all viewsets. The infrastructure has become a little more automation-friendly compared to SPECviewperf 13. Overall, the updated version ensures that SPECviewperf remains the go-to benchmark suite across the industry for system buyers wanting to determine the workstation / GPU combination that can deliver the best value for money for their particular workload.


26 Comments
View All Comments
zamroni - Friday, October 16, 2020 - link
Is anand tech drunk? Integrated and gaming gpu for workstation benchmark article?CiccioB - Sunday, October 18, 2020 - link
How limited view.How do you know if GPUs advertised for professional work are really up to their price if you do not have a comparison with the basic consumer ones?
Icehawk - Friday, October 16, 2020 - link
Would have liked to see an explanation of TDRCiccioB - Sunday, October 18, 2020 - link
Ok, this is the base comparison, now go with the big guns to see if 4 times the price of the relative gaming GPUs for the professional board has a reason.BedfordTim - Monday, October 19, 2020 - link
That would require testing the support available as well as the hardware/software.abufrejoval - Monday, October 19, 2020 - link
Just like previous incarnations of this benchmark Viewperf has become completely useless, because the software underneath uses technology that must be two decades old.More than 90% of all workloads are single threaded, accordingly on my 18/36 core/thread system CPU load hardly ever reaches 5%, I’ve seen some rare cases going to 8%, there is one tiny blip at 22%.
On the (RTX 2080ti) GPU side loads are a little higher, but you can see how the more complex/modern rendering mechanisms, which actually start to offload at least tiny bits of the display list processing to the GPU (or at least eliminate some of the hidden lines) ran fastest, while the least complex wireframe models, which are just an endless forth and back between the CPU and GPU about drawing a tiny little line, run slowest: Imagine driving a Ferrari between your home and the shopping mall, purchasing every single noodle for a family dinner and you get the idea.
Watching the benchmark is a window back into what passive frame buffers were like and how graphics cards that could at least draw full lines or even some shaded triangles changed the game. Even an iGPU should outperform all of the “benchmark” if only it were written with a modern API and the geometry data managed by the GPU.
While my RTX 2080ti/E5-2696v3 combo seems to provide a significant uplift of your 4k results, using this ‘benchmark’ really as a benchmark, is about the worst idea you might have. Don’t waste your time installing, at least those un-zip jobs seem to use up to 50% of all CPU, but they still take a lot of time, even on NVMe storage.
ganeshts - Monday, October 19, 2020 - link
Have you compared it against the actual behavior of the applications like 3ds Max, Creo, etc.?The purpose of the benchmark is to replay traces that are generated from the programs used by professionals in the field. If you believe that those programs could be written better with a modern API and data management by the GPU, then you should take it up with Autodesk, Siemens NX, and the like, instead of blaming SPEC. On the other hand, if the behavior of those professional programs is different from that of what viewperf does, then it would be worth giving feedback to SPECgpc about that.
abufrejoval - Tuesday, October 20, 2020 - link
Please Ganesh, use your powers of observation and some logic.If you look at the spinning models, you can observe that they are redrawn and spinning the fastest, when they are using the highest quality surfaces with no wireframe showing, reflections from lights even mirroring from other objects. And then they typically regress to what looks like Gouraud-shading and sometimes even wireframe and we can see that these are slower and that can’t really be, because a wireframe from display list data on the GPU would just require *less* processing and be spinning so fast you’d never see more than a blur.
Looking at HW-Info during the execution on a secondary screen, you can tell what’s going on: The CPU is sending all the drawing commands a single CPU core can stuff into the GPU pipeline, but it’s evidently not a full display list and then a series of ‘spin’ (geometric translation) commands, but it’s a series of wireframe lines, one after one in one very busy loop. It shows in the power consumption of the GPU, too, which is very low while the GPU core is 80% active (reading the shared memory command queue across the PCIe bus).
On the shaded models GPU power consumption goes up a third or more, because there the GPU actually is using some of its acceleration resources to do the surfaces, bump maps, textures, reflections and a lot more geometry work, because the interaction between the CPU and GPU is now at the level of full display lists and geometry translation commands.
The professional 3D software market serves its customers and those aren't very interested in things happing faster than an engineer’s mind. They also much more interested in things being exact, a true digital twin, at least for the design (digital crash testing or finite element optimizations would be another story).
It’s the validation of drivers, making sure there are no bugs resulting in a wrong display, which make this market expensive. The times when graphics power was still a decisive issue which needed hundreds of thousands or earlier millions of Dollars to obtain the sort of graphics power a mobile phone today delivers without getting warm, are over.
Please discuss with your colleagues, if you don’t believe me.
If you compare what you see in these benchmarks and what you see in current Flight Simulators and car racing simulators like Project Cars 2, that should start you thinking.
ganeshts - Tuesday, October 20, 2020 - link
I never said that I didn't believe you. Instead, I said that viewperf faithfully replays the sort of GPU load and CPU-GPU communication that an engineer actually triggers when working on those softwares. As I mentioned earlier, if you think those are not efficient (which may well be the case), you should take it up with Autodesk and the like. not SPECgpc.Have you also considered that the engineer working on these 3D models might actually have a workflow that makes it necessary for the frequent CPU - GPU communication you observed? It is not always just a final rendering flow that is typical of video / animation work, but live user-triggered modifications and re-rendering that might result in the trace being replayed.
abufrejoval - Tuesday, October 20, 2020 - link
To moderate my criticism somewhat: If you know what you are looking for, ViewPerf may be useful to verify some alternatives.My main issue with it is that judging by the comments, most people here clearly are mislead into thinking that these results can be extrapolated to gaming. And that's simply not the case, because game engines have evolved to use much higher level (but potentially less exact) graphics primitives to give you the eye-candy and speed you just love to pay for. It's more monsters games ask for, not that the second wart on the inside of the left pinky be just precise 0.35mm in height or an exact color match. Engineers get fired when the first couple thousand cars off an assembly line need to be crushed, because an engine mount is off by 1mm.
If the benchmark as you say actually replays traces from applications and doesn't contain the core parts of the application itself, it may be even less useful as a benchmark, because it doesn't measure the application side.
But if it has high fidelity with regards to the traces, what is obvious is that the applications all just use a single CPU core to feed the graphics interface. That's quite simply how things were done two decades ago and it's only with Mantle/DX12 that GPU interfaces seriously supported multi-threaded CPU/GPU interfaces: Clearly there is none of that in these traces, even if some actually use DX12. Either the applications are inherently still using a single thread to communicate with the GPU or the capturing mechanism serializes the capture.
I tend to believe the applications haven't really been refactored for multi-threading the GPU interface... because engineers don't play games and for pure design a 2 GHz CPU and a passive graphics card at 2k has been good enough for the guys raised on paper an pencils.
Case in point: The fact that the Siemens Unigraphics/NX benchmark runs ~4x faster on Vega or even almost 2x as fast on a lowly Ryzen 7-4800U than a RTX 2070 clearly doesn't allow you to extrapolate performance *anywhere* except this very special case of using this Siemens product.
And here most likely Siemens and AMD simply agreed at one point to have the Siemens product support a higher level API for rendering, than what is used for all others (Nvidia among them).
I'd bet four cases of the best Belgian beer, that with a bit of API tuning, Nvidia 3xxx GPUs could match or even exceed the Vega 56 scores, simply by having the Ferrari shop for bags of noodles, instead of individual ones.
Siemens NX is 40 years old. I'm not sure a single line of code from the original 1978 version still survives, but I am also pretty sure, it hasn't all been refactored into Rust or CUDA or OpenMP either.
Just how well it supports dozens of general purpose CPU cores, thousands of GPU cores, scale-out, Cerebras wafer level accelerators or Quantum computing... I already said, I am betting some of the best beer in the world on single threaded 64-Bit AVX everything with some DX12 sugar coating at best: A Ryzen 7 4750G should just do fine, a Ryzen 3 4350G won't do much worse, either.