Testing The World’s Best APUs: Desktop AMD Ryzen 4750G, 4650G and 4350G
by Dr. Ian Cutress on December 16, 2020 10:30 AM ESTPower Consumption
The nature of reporting processor power consumption has become, in part, a dystopian nightmare. Historically the peak power consumption of a processor, as purchased, is given by its Thermal Design Power (TDP, or PL1). For many markets, such as embedded processors, that value of TDP still signifies the peak power consumption. For the processors we test at AnandTech, either desktop, notebook, or enterprise, this is not always the case.
Modern high performance processors implement a feature called Turbo. This allows, usually for a limited time, a processor to go beyond its rated frequency. Exactly how far the processor goes depends on a few factors, such as the Turbo Power Limit (PL2), whether the peak frequency is hard coded, the thermals, and the power delivery. Turbo can sometimes be very aggressive, allowing power values 2.5x above the rated TDP.
AMD and Intel have different definitions for TDP, but are broadly speaking applied the same. The difference comes to turbo modes, turbo limits, turbo budgets, and how the processors manage that power balance. These topics are 10000-12000 word articles in their own right, and we’ve got a few articles worth reading on the topic.
- Why Intel Processors Draw More Power Than Expected: TDP and Turbo Explained
- Talking TDP, Turbo and Overclocking: An Interview with Intel Fellow Guy Therien
- Reaching for Turbo: Aligning Perception with AMD’s Frequency Metrics
- Intel’s TDP Shenanigans Hurts Everyone
In simple terms, processor manufacturers only ever guarantee two values which are tied together - when all cores are running at base frequency, the processor should be running at or below the TDP rating. All turbo modes and power modes above that are not covered by warranty. Intel kind of screwed this up with the Tiger Lake launch in September 2020, by refusing to define a TDP rating for its new processors, instead going for a range. Obfuscation like this is a frustrating endeavor for press and end-users alike.
However, for our tests in this review, we measure the power consumption of the processor in a variety of different scenarios. These include full AVX2/AVX512 (delete as applicable) workflows, real-world image-model construction, and others as appropriate. These tests are done as comparative models. We also note the peak power recorded in any of our tests.
First up is our image-model construction workload, using our Agisoft Photoscan benchmark. This test has a number of different areas that involve single thread, multi-thread, or memory limited algorithms.
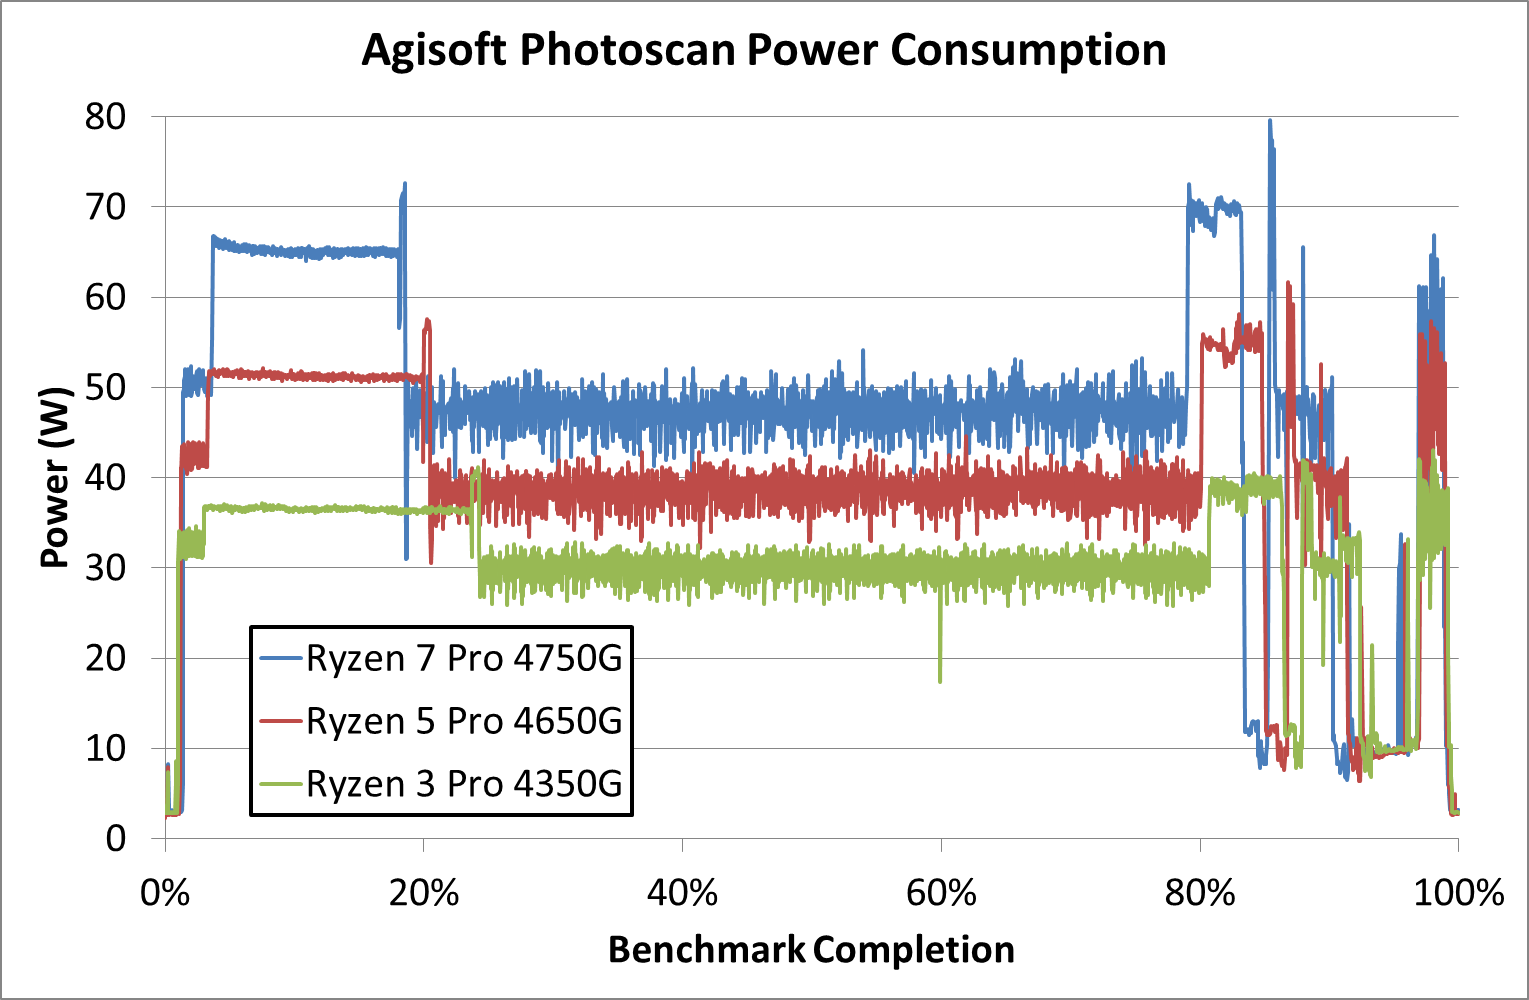
Each of our three processors here seems to approach different steady state power levels for the different areas of the benchmark.
- The 8-core is around 65 W in the first stage, and more around 48 W in the second stage.
- The 6-core is around 51 W in the first stage, and more around 38 W in the second stage.
- The 4-core is around 36 W in the first stage, and more around 30 W in the second stage.
The fact that the difference between each of the processors is 14-15 W in the first stage would go a little to suggesting that we're consuming ~7 W per core in this part of the test, which is strictly multi-threaded. However when it moves more into variable threaded loading, all three CPUs are well below the TDP levels.
The second test is from y-Cruncher, which is our AVX2/AVX512 workload. This also has some memory requirements, which can lead to periodic cycling with systems that have lower memory bandwidth per core options.

The y-Cruncher test is a little different, as we're mostly concerned about peaks. All three CPUs have a TDP rating of 65 W, however the 8-core here breaches 80 W, the 6-core is around 72 W, and the only processor below that TDP value is the quad core Ryzen 3.
For absolute peak power across all of our tests:

For absolute instanteous peak power, each of the Ryzen R4000 APUs does what was expected - with the Ryzen 7 hitting the socket limit for 65 W processors.


104 Comments
View All Comments
peevee - Wednesday, December 23, 2020 - link
5xxx are not APUs.chaosys - Friday, December 25, 2020 - link
Please Dr. Cutress it is customer or enduser, home user or something more appropriate . I don’t consume CPU’s, or gpu‘s. I don’t eat or drink them and afterwards they are gone.Scubasausage - Monday, April 5, 2021 - link
Love your work as always etc. But why not civ turn time!? It’s the only game I ever play on my laptop and fps doesn’t seem to mean much. I find the fps is highest whilst I’m waiting for a turn to process which would tell me that the slower the CPU at turn time the higher the average fps? Besides no ones pushing for higher fps in Civ. it’s a virtual board game almost!prateekprakash - Friday, July 30, 2021 - link
Greetings. I got hold of a 4350G, and I see it can't play youtube HDR content in 720p and above without dropping the frames. The iGPU in task manager shows 90%+ usage during playback. video codec shows av01 and vp09. 1080p HDR youtube playback is a stutterfest. 8k HDR youtube content moves like slideshow, because CPU gets loaded instead of GPU.Am I missing something, or does this APU not have the necessary codec decoding ability to play youtube videos?
A detailed HTPC investigation for video playback with these APUs would be much appreciated!