The Best Server CPUs part 2: the Intel "Nehalem" Xeon X5570
by Johan De Gelas on March 30, 2009 3:00 PM EST- Posted in
- IT Computing
| Website: MCS eFMS (Windows 2003 32-bit EE) | |
| Operating System | Windows 2003 R2 - 32-bit |
| Software | MCS eFMS 9.2 |
| Benchmark software | vApus + real world "MCS" PHP site |
| Typical error margin | 1-2% |
One very interesting and processing intensive application that we encountered was the modular MCS Enterprise Facility Management Software (MCS eFMS), developed by MCS. The objective of eFMS is to integrate the management of space usage (buildings), assets and equipment (such as furniture, beamers etc.), cabling infrastructure, and others while keeping track of costs. MCS eFMS stores all information in a central Oracle database.
MCS eFMS integrates space management, room reservations and much more…
What makes the application interesting to us as IT researchers is the integration of three key technologies. First, it uses a web-based front end that integrates CAD drawings and gets its information from a rather complex, ERP-like Oracle database. It provides building overview trees of all rooms available and their reservations in a certain building. Finally, it allows users to drill down using the CAD drawing to get more detail. MCS eFMS is one of the most demanding web applications we have encountered so far. MCS eFMS uses the following software:
- Microsoft IIS 6.0 (Windows 2003 Server Standard Edition R2)
- PHP 4.4.0
- FastCGI
- Oracle 9.2
Large international companies such as Siemens, Ernst & Young, and Startpeople use MCS eFMS daily, which makes testing this application even more attractive. We tested with both single CPU and dual CPU configurations.
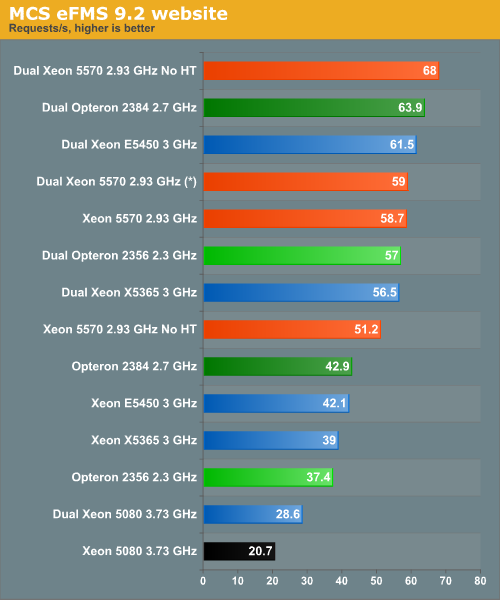
(*) CPU load was at 50-55%.
For once, the Opteron stays in the slipstream of the Xeon X5570. If you look at the single CPU results, you can see that something went wrong: the Xeon X5570 with HT enabled is about 37% faster than the Opteron at 2.7GHz, but once we add a second Xeon X5570, the website refuses to perform better. Without Hyper-Threading, adding four more cores leads to a 32% performance increase from 51.2 responses per second to 68 responses per second. This seems to be something PHP related, as there are too few PHP threads to actually absorb CPU power. The result is that the dual Xeon X5570 with Hyper-Threading enabled is only loaded at 50%-55%, clearly indicating that the PHP site is not making use of the 16 logical cores. Windows 2003 R2 does not seem to schedule its threads optimally in that case.
This real world test shows that not all applications are capable of scaling up easily. We know from previous tests that this application scales out when you use load balancing. If we only look at the single CPU performance, which is quite common in the website market, we can conclude that Xeon X5570 is about 37% faster than its best competitor and 39% faster than its predecessor (Xeon 54xx). At that point both CPUs are running at 80 to 100% CPU load. You would almost be disappointed after all the spectacular performance numbers that the latest Xeon produced, but a 37% performance advantage is still very impressive.


44 Comments
View All Comments
snakeoil - Monday, March 30, 2009 - link
oops it seems that hypertreading is not scaling very well too bad for inteleva2000 - Tuesday, March 31, 2009 - link
Bloody awesome results for the new 55xx series. Can't wait to see some of the larger vBulletin forums online benefiting from these monsters :)ssj4Gogeta - Monday, March 30, 2009 - link
huh?ltcommanderdata - Monday, March 30, 2009 - link
I was wondering if you got any feeling whether Hyperthreading scaled better on Nehalem than Netburst? And if so, do you think this is due to improvements made to HT itself in Nehalem, just do to Nehalem 4+1 instruction decoders and more execution units or because software is better optimized for multithreading/hyperthreading now? Maybe I'm thinking mostly desktop, but HT had kind of a hit or miss reputation in Netburst, and it'd be interesting to see if it just came before it's time.TA152H - Monday, March 30, 2009 - link
Well, for one, the Nehalem is wider than the Pentium 4, so that's a big issue there. On the negative side (with respect to HT increase, but really a positive) you have better scheduling with Nehalem, in particular, memory disambiguation. The weaker the scheduler, the better the performance increase from HT, in general.I'd say it's both. Clearly, the width of Nehalem would help a lot more than the minor tweaks. Also, you have better memory bandwidth, and in particular, a large L1 cache. I have to believe it was fairly difficult for the Pentium 4 to keep feeding two threads with such a small L1 cache, and then you have the additional L2 latency vis-a-vis the Nehalem.
So, clearly the Nehalem is much better designed for it, and I think it's equally clear software has adjusted to the reality of more computers having multiple processors.
On top of this, these are server applications they are running, not mainstream desktop apps, which might show a different profile with regards to Hyper-threading improvements.
It would have to be a combination.
JohanAnandtech - Monday, March 30, 2009 - link
The L1-cache and the way that the Pentium 4 decoded was an important (maybe even the most important) factor in the mediocre SMT performance. Whenever the trace cache missed (and it was quite small, something of the equivalent of 16 KB), the Pentium 4 had only one real decoder. This means that you have to feed two threads with one decoder. In other words, whenever you get a miss in the trace cache, HT did more bad than good in the Pentium 4. That is clearly is not the case in Nehalem with excellent decoding capabilities and larger L1.And I fully agree with your comments, although I don't think mem disambiguation has a huge impact on the "usefullness" of SMT. After all, there are lots of reasons why the ample execution resources are not fully used: branches, L2-cache misses etc.
IntelUser2000 - Tuesday, March 31, 2009 - link
Not only that, Pentium 4 had the Replay feature to try to make up for having such a long pipeline stage architecture. When Replay went wrong, it would use resources that would be hindering the 2nd thread.Core uarch has no such weaknesses.
SilentSin - Monday, March 30, 2009 - link
Wow...that's just ridiculous how much improvement was made, gg Intel. Can't wait to see how the 8-core EX's do, if this launch is any indication that will change the server landscape overnight.However, one thing I would like to see compared, or slightly modified, is the power consumption figures. Instead of an average amount of power used at idle or load, how about a total consumption figure over the length of a fixed benchmark (ie- how much power was used while running SPECint). I think that would be a good metric to illustrate very plainly how much power is saved from the greater performance with a given load. I saw the chart in the power/performance improvement on the Bottom Line page but it's not quite as digestible as or as easy to compare as a straight kW per benchmark figure would be. Perhaps give it the same time range as the slowest competing part completes the benchmark in. This would give you the ability to make a conclusion like "In the same amount of time the Opteron 8384 used to complete this benchmark, the 5570 used x watts less, and spent x seconds in idle". Since servers are rarely at 100% load at all times it would be nice to see how much faster it is and how much power it is using once it does get something to chew on.
Anyway, as usual that was an extremely well done write up, covered mostly everything I wanted to see.
7Enigma - Wednesday, April 1, 2009 - link
I think that is a very good method for determining total power consumption. Obviously this doesn't show cpu power consumption, but more importantly the overall consumption for a given unit of work.Nice thinking.
JohanAnandtech - Wednesday, April 1, 2009 - link
I am trying to hard, but I do not see the difference with our power numbers. This is the average power consumption of one CPU during 10 minutes of DVD-store OLTP activity. As readers have the performance numbers, you can perfectly calculate performance/watt or per KWh. Per server would be even better (instead of per CPU) but our servers were too different.Or am I missing something?