Retesting the ASUS Rampage IV Black Edition Audio and the Pitfalls of Audio Testing
by Ian Cutress on January 31, 2014 4:45 AM EST- Posted in
- Motherboards
- Asus
- Audio
- Audio Precision
In the motherboard section of AnandTech, we rarely touched the audio section of the motherboard until fairly recently. Audio is a delicate issue, and knowledge on the subject falls into a wide range from the tone deaf all the way to the hyper enthusiast. Professional and prosumer audio equipment can be honed to perfection and cost an appropriate amount, where discussion on quality over $10k per meter cables can happen. It is very hard to quantify an audio experience into a single set of rules, but as the motherboard arena can feature rather elaborate audio setups designed to enhance the quality or provide sufficient electrical filtering, and that these can be some of the major selling points, several of our readers asked us to start testing the audio.
To put this into perspective, a motherboard manufacturer can create an audio portion of the motherboard that costs $2 to buy and implement. Another manufacturer will spend $20 to get a better audio codec and DAC, better audio filters, headphone amplifiers, and specifically separate the digital and audio traces on the motherboard as to reduce potential sources of interference, as well as focusing on a single output to achieve all this. Part of testing these scenarios is producing such a test that a reader can relate to, as well as a series of numbers for comparison to put in the review – both manufacturers and readers want to see that their hard earned engineering money and effort went into something that can be compared.
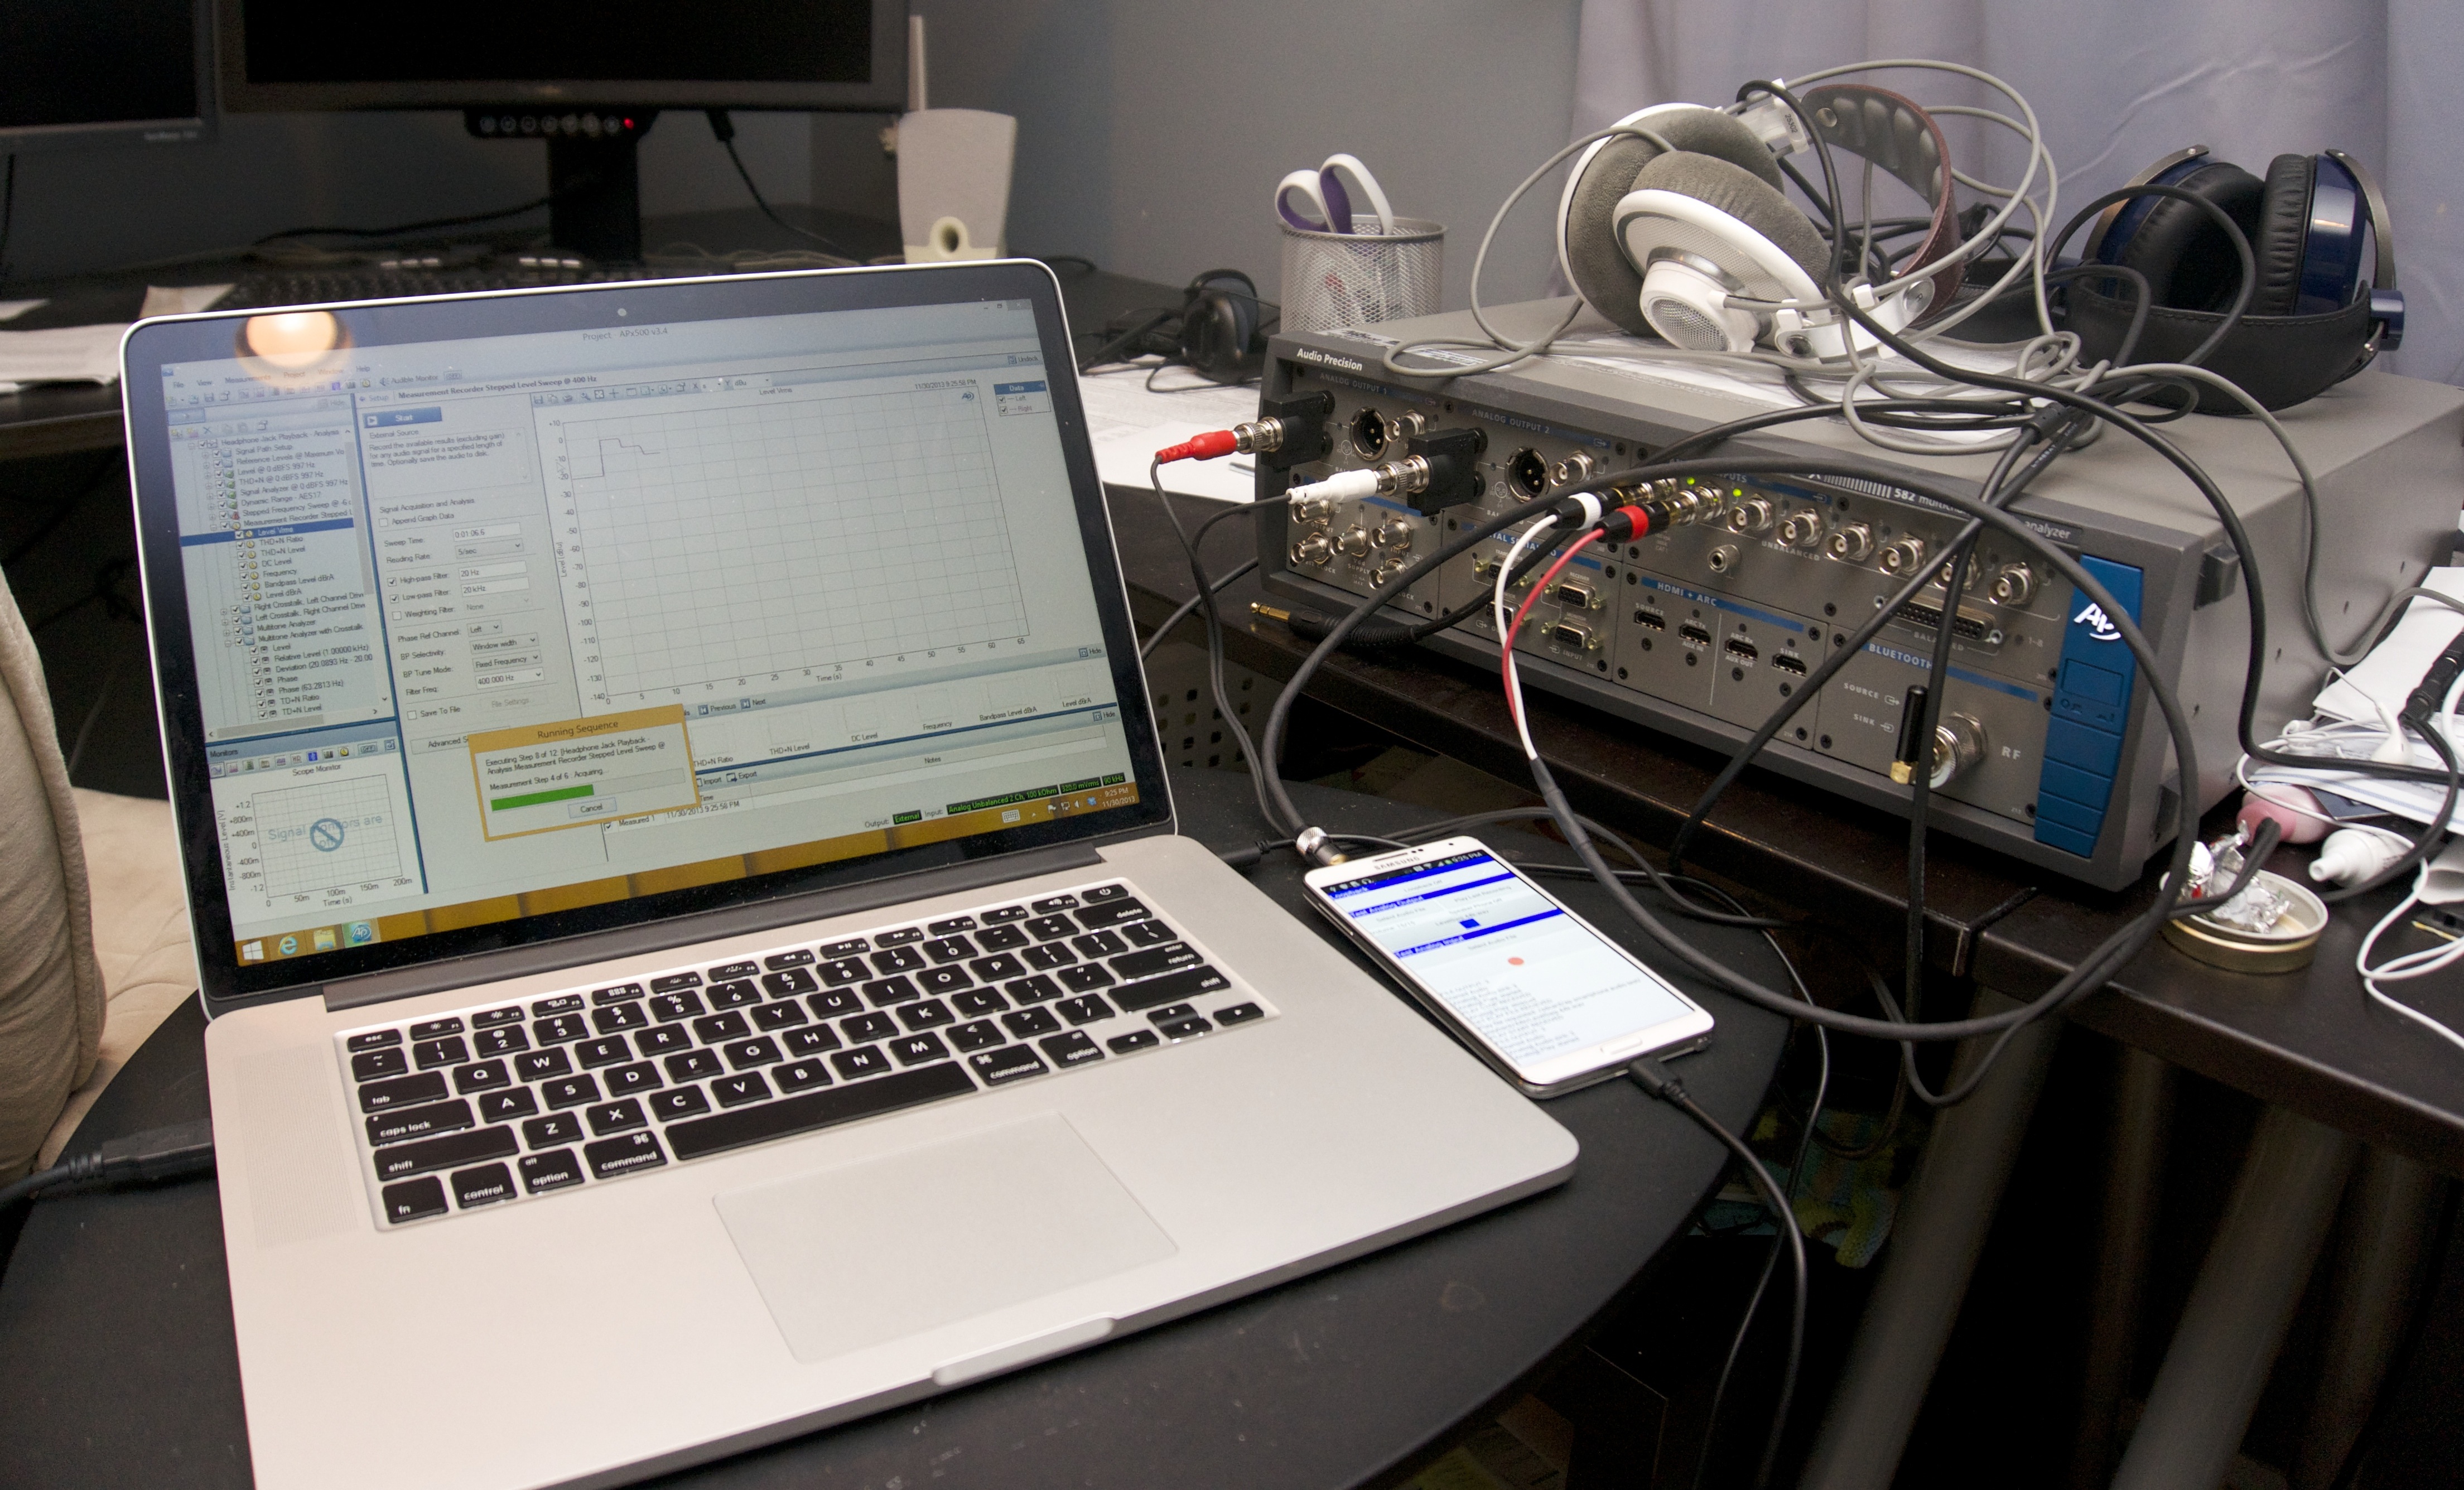
In light of this request to test audio, looking into the best way to test it is a minefield. The correct equipment in order to get an accurate test of dynamic range, noise and distortion costs over $10k – for example, the audio equipment used in Chris Heinonen’s recent foray into smartphone audio testing was an Audio Precision APx582, which starts at eleven thousand. Audio Precision is often cited as the company that all audio manufacturers go to in order to test their hardware. Unfortunately unlike Chris I am not able to source Audio Precision testing equipment due to my location and contacts, but having the hardware on hand takes everything out of the equation except the audio generator and filtering pathway that a manufacturer decides to use.
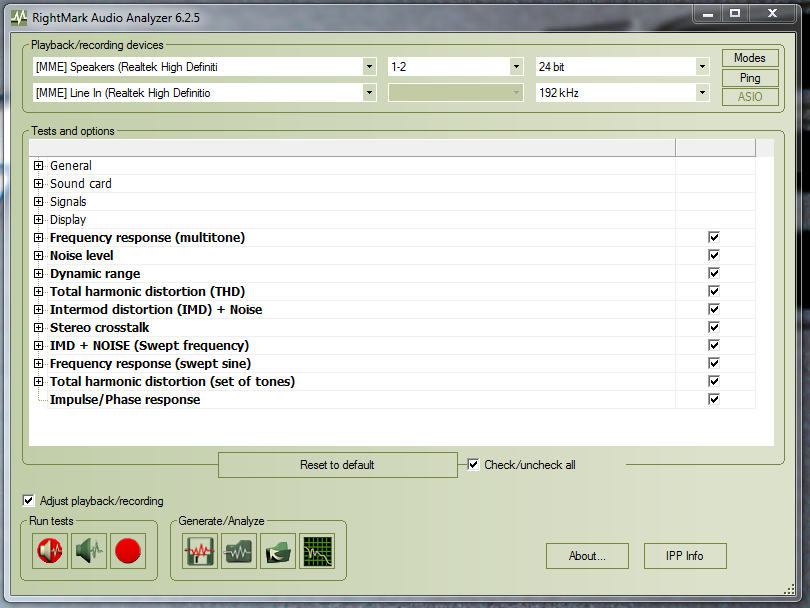
One ‘quick and easy’ test that has been in the mix and in several press pack guides is Rightmark: Audio Analyzer (RM:AA). This is a software solution to what is ultimately a hardware problem, and relies on the same hardware doing both the signal production and the signal receiving. This causes a number of issues, such as channel leakage, harmonic resonance in adjacent signals and that the limiting factor of the hardware being testing might affect other parts of the test. More often than not it is also difficult to compare results between products, due to input levels and driver settings. In order to provide accurate and comparable results, the software has to be explicitly set up for consistency and comparison, something a lot of reviewers that use RM:AA do not do.

I must confess that for a while I was in this crowd. My RM:AA test was ultimately out of the box and produced wildly conflicting results. When audio solutions were quoted as 108 dB for signal-to-noise ratio were getting 92 dB, the conclusions were along the lines of differences in signaling and manufacture of the motherboard. In reality, the test was very wrong – the OS by default limits input/output to 16-bit + 44.1 kHz, producing an artificial ceiling, and the volume ratio of output/input in the testing loop was not standardized. While I kept the input/output the same, in fact each output of the audio jacks can have different responses to the audio in question.
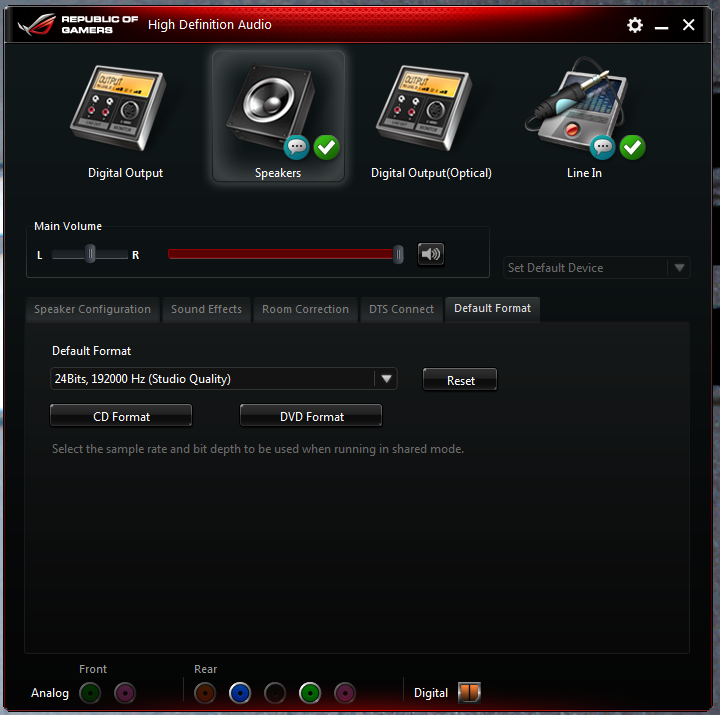
After delving further into the topic, we standardized the RM:AA test at AnandTech. The OS is now set to 24-bit, 192 kHz input and output (or the highest possible based on the audio codec options), the output volume was set to 100% and the input volume adjusted to provide accurate results without over-distorting the input. Ultimately our testing is still limited to the level of the input on the codec, often cited around 104 dB SNR compared to a 108 dB or 112 dB peak output, depending on what audio codec + DAC are used. Even when the same 3.5mm shielded cable is used or different tests, cable losses in a uncontrolled environment can be excessive (1-2 dB SNR), and my location next to a busy main road might also introduce error.
This test is in no way perfect – we typically quote the SNR and THD+N (Total Harmonic Distortion + Noise) results as these were ultimately relevant to those who wanted cleaner and louder output, rather than a quality control test.
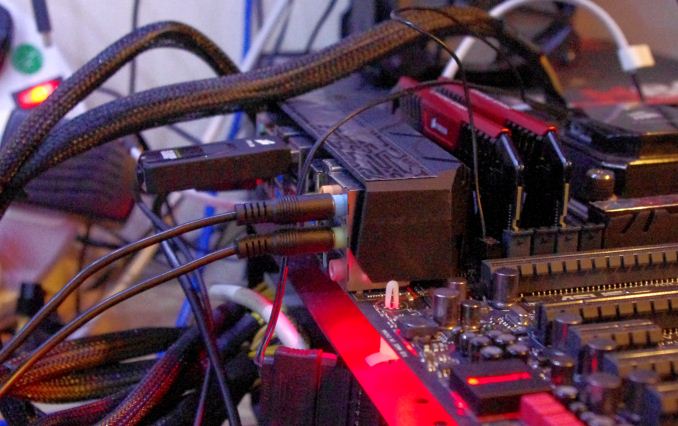
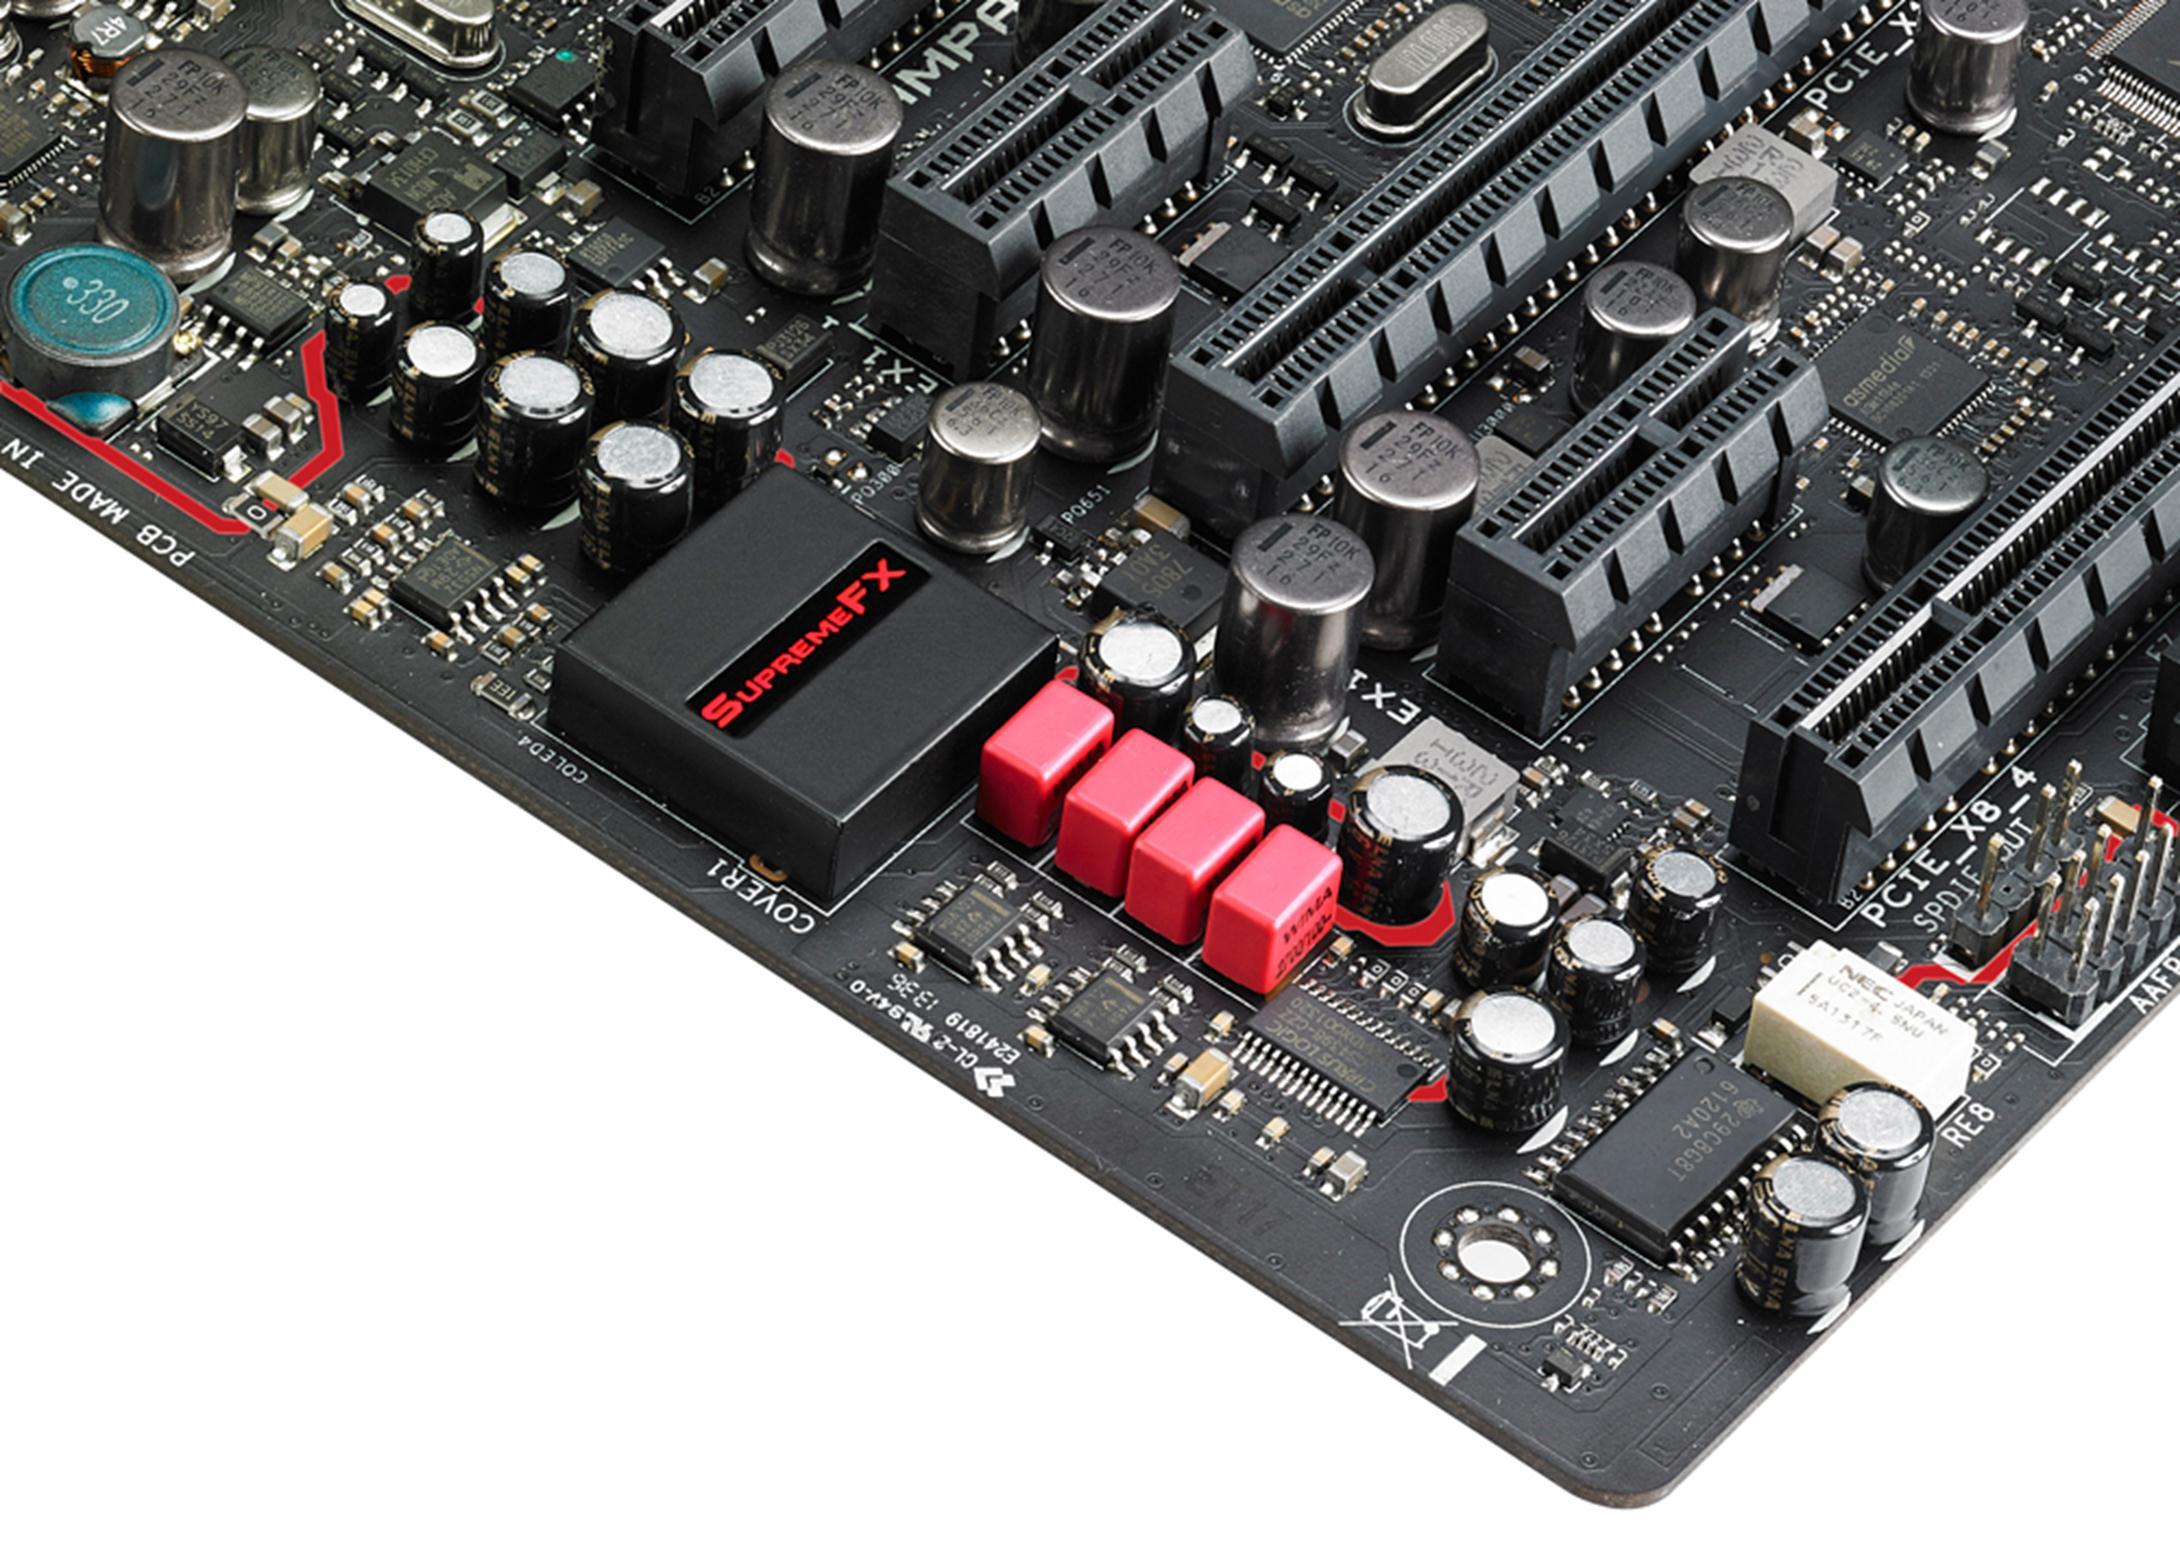
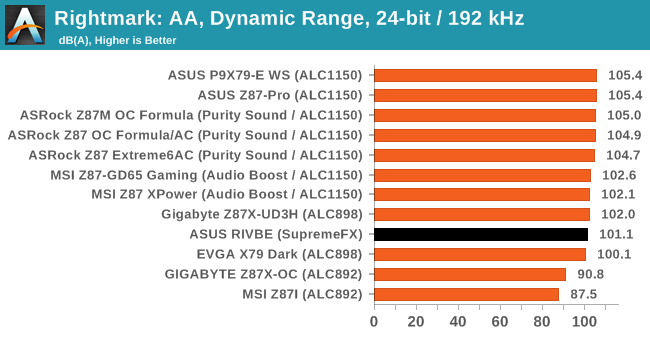
Recently we tested the ASUS Rampage IV Black Edition. In this review, we noted that for ASUS’ audio solution, they used their SupremeFX technology – a shielded audio codec with separated tracing, audio filters, headphone amplifiers and gold plated connectors. In this, ASUS use a Realtek audio codec to power a Cirrus Logic DAC, rated at 120 dB SNR and -107 dB THD+N. Our results were well below this in terms of SNR, ~95 dB, which is substantially lower. At the time I was unsure of the reason, and needless to say ASUS got back to me to confirm my testing methodology.
After retests on my end, and a more professional test from ASUS, we exchanged new numbers for comparison. My initial numbers were indeed erroneous. After retesting, the ASUS Rampage IV Black Edition falls in the middle of the pack:
ASUS and I compared our SNR graphs to see the differences:
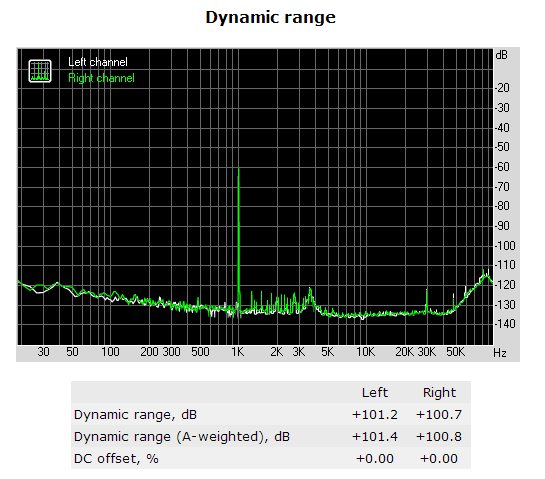
ASUS achieve a -108 dB SNR compared to my -101 dB SNR result due to ASUS using Audio Precision testing tools and my test using the Line In + RMAA methodology. The RMAA test also relies on a 1 kHz pulse at -60 dB for its test rather than a range of frequencies, which as a result causes the peak seen at 1 kHz.
In light of the discrepancy, we are coming to a fork in the road for audio testing. I fall wholeheartedly into the ‘tone deaf’ part of the crowd when it comes to analyzing audio and prefer an easy-to-read number as a comparison, although I understand this is not the be-all and end-all when it comes to audio. Ideally I would like to use Chris’ setup for future motherboard tests. I have asked Chris to perform testing on a few select models if he has time in the future, which might be in the works. But I do not have access to an AP testing setup, and my current solution sits with RM:AA. ASUS has offered to provide their results in future press packs, although independent verification is what we want to report. In light of motherboard development we may see other manufacturers doing it also. In order to improve our reporting in this area, I will in future publish the SNR graphs we receive from RM:AA for comparison.


59 Comments
View All Comments
saratoga3 - Friday, January 31, 2014 - link
>ASUS achieve a -108 dB SNR compared to my -101 dB SNR result due to ASUS using Audio Precision testing tools and my test using the Line In + RMAA methodology. The RMAA test also relies on a 1 kHz pulse at -60 dB for its test rather than a range of frequencies, which as a result causes the peak seen at 1 kHz.I don't see any discrepancy. You're comparing different types of tests. Your RMAA measurement is dynamic range (ratio of a test signal to distortion+noise) while the audio precision test looks like a simple noise floor measurement. In general, the dynamic range is usually less then the noise floor.
Essentially, Asus is choosing a more favorable test to quote numbers from while you are choosing a more realistic one. No surprise really, they want to look good :)
Rajinder Gill - Friday, January 31, 2014 - link
The ASUS test is dynamic range - you just aren't seeing the whole screenshot :)Rajinder Gill - Friday, January 31, 2014 - link
Sweep data:C:\Apwin\VISTA\DA\WL-Dynamic Range.at2c, 09/06/13 16:05:27
DGen.Freq, Anlr.THD+N Ampl, Anlr.THD+N Ampl, ,,,,,
Source 1, Data 1, Data 2, ,,,,,
Hz, dBr A, dBr B, ,,,,,
20000.0009537, -115.647123142, -115.36093713, ,,,,,
15886.5652084, -115.935569993, -115.649383982, ,,,,,
12619.1482544, -115.927113829, -115.640927817, ,,,,,
10023.7455368, -116.310144004, -116.023957992, ,,,,,
7962.14389801, -116.482618551, -116.196432539, ,,,,,
6324.55444336, -116.621886408, -116.335700397, ,,,,,
5023.77319336, -116.512704794, -116.226518782, ,,,,,
3990.52333832, -116.387036958, -116.100850946, ,,,,,
3169.78740692, -116.236844922, -115.95065891, ,,,,,
2517.85182953, -115.960987994, -115.674801983, ,,,,,
2000.00095367, -115.848584101, -115.56239809, ,,,,,
1588.65737915, -115.533297062, -115.247111051, ,,,,,
1261.91425323, -115.412973441, -115.126787429, ,,,,,
1002.37369537, -115.315274306, -115.029088294, ,,,,,
796.214103699, -115.273364021, -114.98717801, ,,,,,
632.454872131, -115.161721996, -114.875535984, ,,,,,
502.378463745, -115.179798775, -114.893612764, ,,,,,
399.052619934, -115.013372807, -114.727186795, ,,,,,
316.97845459, -115.123112258, -114.836926247, ,,,,,
251.784324646, -115.10771629, -114.821530279, ,,,,,
199.999809265, -114.993108255, -114.706922243, ,,,,,
158.866882324, -114.925062347, -114.638876336, ,,,,,
126.191139221, -115.19014528, -114.903959269, ,,,,,
100.238800049, -115.09490713, -114.808721119, ,,,,,
79.6222686768, -115.236857676, -114.950671665, ,,,,,
63.2457733154, -115.125680908, -114.839494896, ,,,,,
50.2367019653, -115.156564104, -114.870378092, ,,,,,
39.9055480957, -115.117977236, -114.831791224, ,,,,,
31.6972732544, -115.265528306, -114.979342294, ,,,,,
25.1798629761, -115.268139426, -114.981953414, ,,,,,
20.001411438, -115.375876845, -115.089690834, ,,,,,
test page image came from: http://imageshack.com/a/img571/1842/3ej1.png
saratoga3 - Friday, January 31, 2014 - link
What is the test signal amplitude?AggressorPrime - Friday, January 31, 2014 - link
Thank you for your further research in this issue, and I look forward to seeing more refined testing in your audio reviews. Like some of the other commentators have mentioned, please stick to numbered results. And kind of hearing tests should only be icing on the cake, not certifiable evidence, considering how the brain likes to fill in the gaps.I've recently started looking more and more into audiophile grade equipment. I start off on a site that seems to do a great job explaining how one DAC, amp, headphones, or speaker sounds better than another, then I see them talking about how digital cables can sound different, how SATA and fan cables can make your audio better, how a black box you put your laptop on can improve audio, and that site just loses all credibility. I can't trust people who ignore science and believe in magic.
TheRealAnalogkid - Saturday, February 1, 2014 - link
Being a musician and an audiophile (by necessity, I pay as little as I can to get by) I have to disagree with many of the blanket "snake oil" comments. There is a need for better audio outside of a studio environment. Even on a game mobo audio is distracting; fortunately the Asus STX cards are a good substitute and don't cost a fortune. Just simply going "digital out" isn't as open and shut as it sounds. I wish it wasn't so, believe me.sheh - Saturday, February 1, 2014 - link
"Professional and prosumer audio equipment can be honed to perfection and cost an appropriate amount, where discussion on quality over $10k per meter cables can happen."10,000$ for a cable wouldn't be an appropriate amount, but snake oil. :)
StrangerGuy - Saturday, February 1, 2014 - link
Is there really a point to this anyway? A next to nothing improvement for nearly everybody with an overpriced board on one hand, and 3.5mm jacks on any mobo which will never satisfy the golden ears crowd.Rick83 - Saturday, February 1, 2014 - link
I'll stick with my former recommendation of using an affordable, but standard across all tests soundcard to separately test in- and outputs.And not to test at only a single frequency, but instead try to get at least a certain amount of key pulses to go through.
Currently there's no single fixed point in the measurement approach, no reference, nothing. By going with a reference card, you're of course limited by the quality of its inputs and outputs, but at least you can attempt to get a feel for those, and then obtain a set of comparable results.
popej - Saturday, February 1, 2014 - link
Measurement equipment should be more precise than measured device. Typical audio input on mother board is not proper equipment. Asus even doesn't provide audio input specification on their site. But 100dB of dynamic range is a very good value for input. BTW, you seems to mix dynamic range with SNR, which are 2 different measurement in RMAA.