Next Gen NVMe SD Card Review: The SM2708 Controller Serves it Hot and Fast
by Ganesh T S on September 9, 2021 9:00 AM EST- Posted in
- Storage
- NAND
- flash
- NVMe
- Silicon Motion
- Memory Cards
- 3D TLC
- SD Express
Simulating Extended Usage
The performance of memory cards tends to go down over time as wear and tear on the NAND takes its toll. In order to simulate long-term usage, we subject the card to heavy traffic - similar to what one might do with direct-attached storage devices such as external drives. This traffic is also monitored to estimate performance consistency and relative performance numbers. Thanks to the exposure of the SD Express card as a standard NVMe device, the internal temperature of the SD Express card is also monitored.
AnandTech DAS Suite
Usage scenarios for memory cards may involve transfer of large amounts of photos and videos. Other usage scenarios include the use of the unit as a download or install location for games in portable game consoles, and importing files directly from it into a multimedia editing program such as Adobe Photoshop (for quick edits). Some users may even opt to boot an OS off a memory card in single-board computers.
The AnandTech DAS Suite tackles the first use-case. The evaluation involves processing four different workloads:
- AV: Multimedia content with audio and video files totalling 24.03 GB over 1263 files in 109 sub-folders
- Home: Photos and document files totalling 18.86 GB over 7627 files in 382 sub-folders
- BR: Blu-ray folder structure totalling 23.09 GB over 111 files in 10 sub-folders
- ISOs: OS installation files (ISOs) totalling 28.61 GB over 4 files in one folder
Each data set is first placed in a 29GB RAM drive, and a robocopy command is issue to transfer it to the memory card (formatted in exFAT).
robocopy /NP /MIR /NFL /J /NDL /MT:32 $SRC_PATH $DEST_PATH
Upon completion of the transfer (write test), the contents from the unit are read back into the RAM drive (read test) after a 10 second idling interval. This process is repeated three times for each workload. Read and write speeds, as well as the time taken to complete each pass are recorded. Whenever possible, the temperature of the memory card is recorded during the idling intervals. Bandwidth for each data set is computed as the average of all three passes.
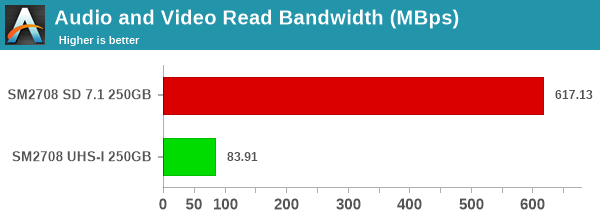
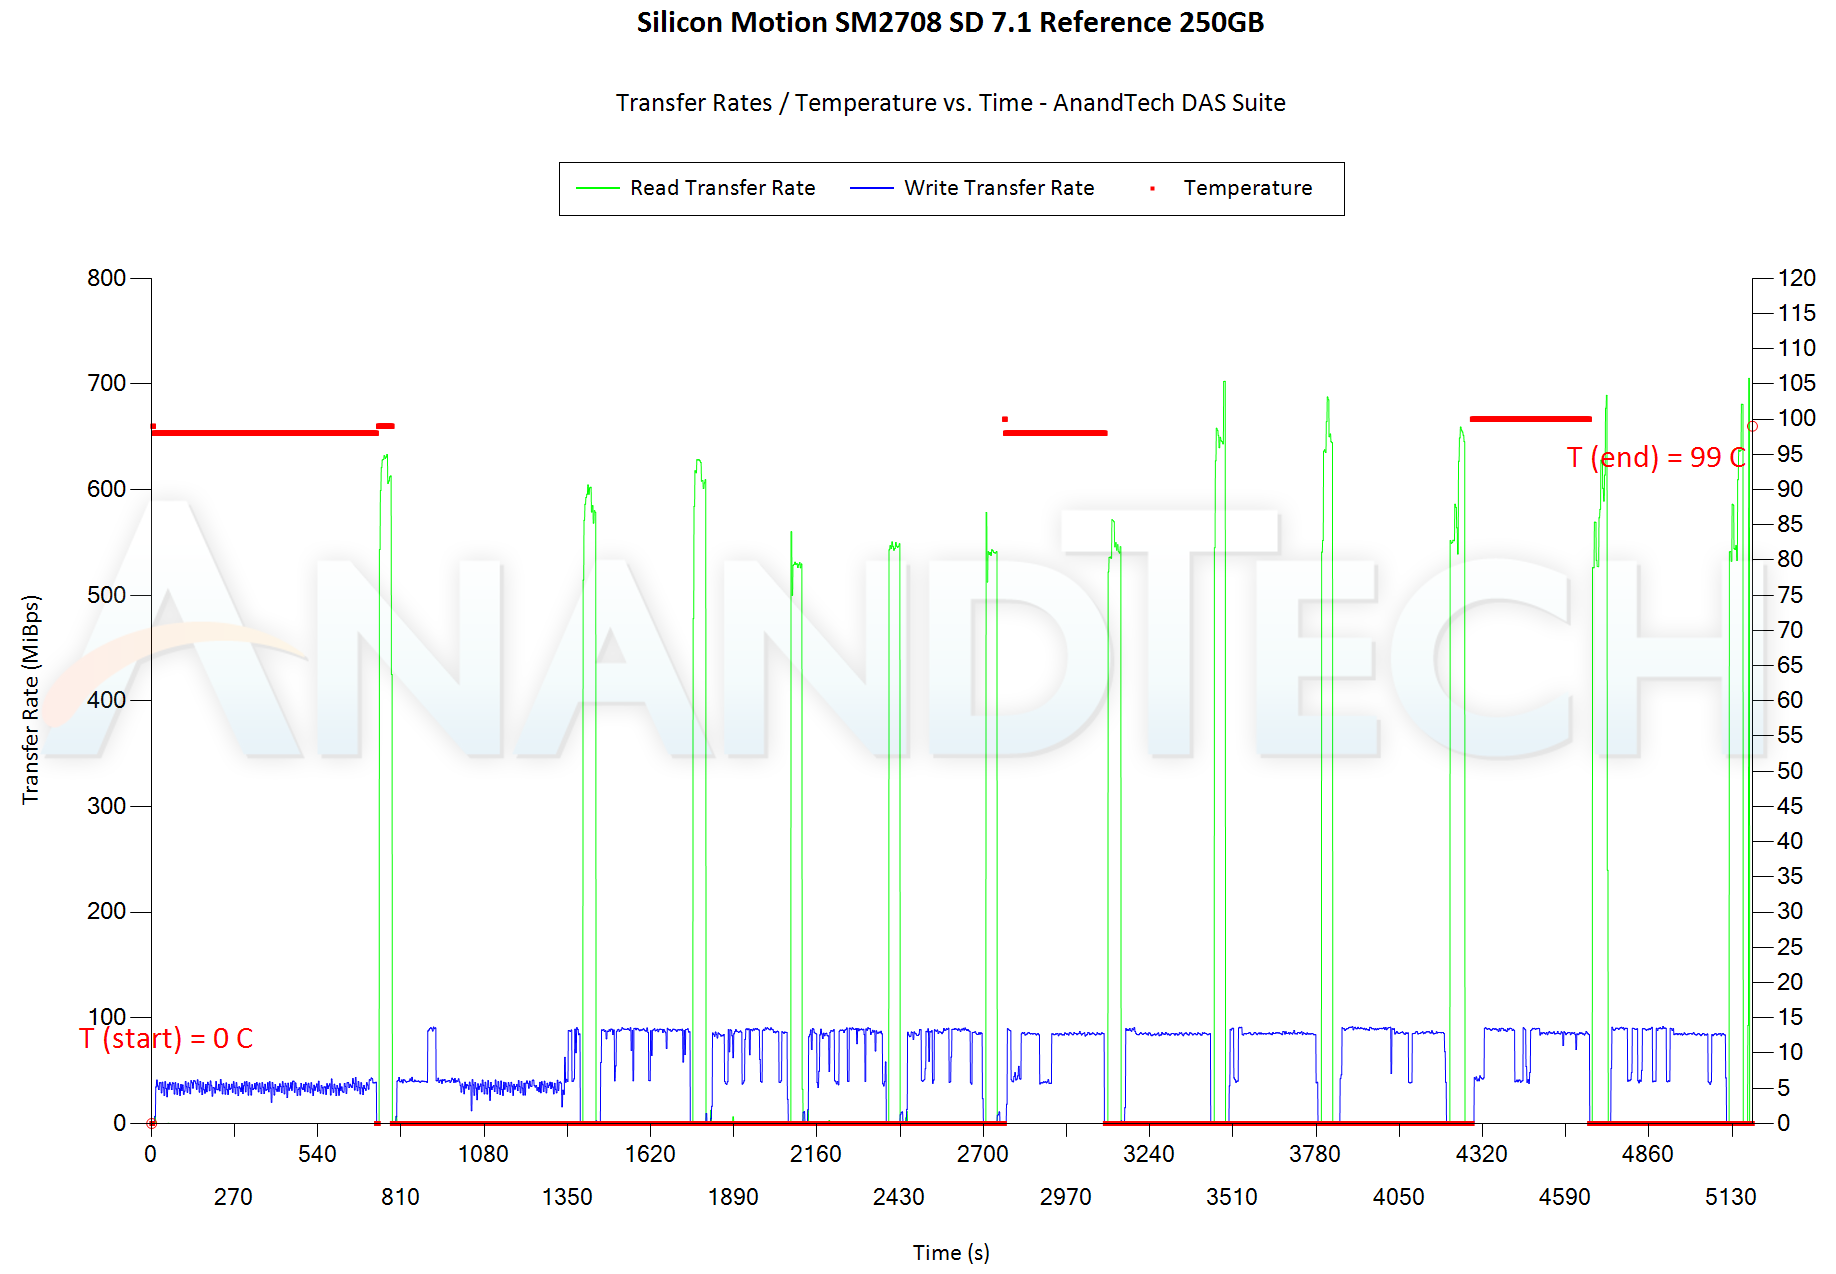
The reads for most passes are well above 500 MBps+. However, in the midst of heavy writes (going beyond the ~5.5 GB SLC cache), the speeds drop below 100 MBps, as evident in the above graphs.
Performance Consistency
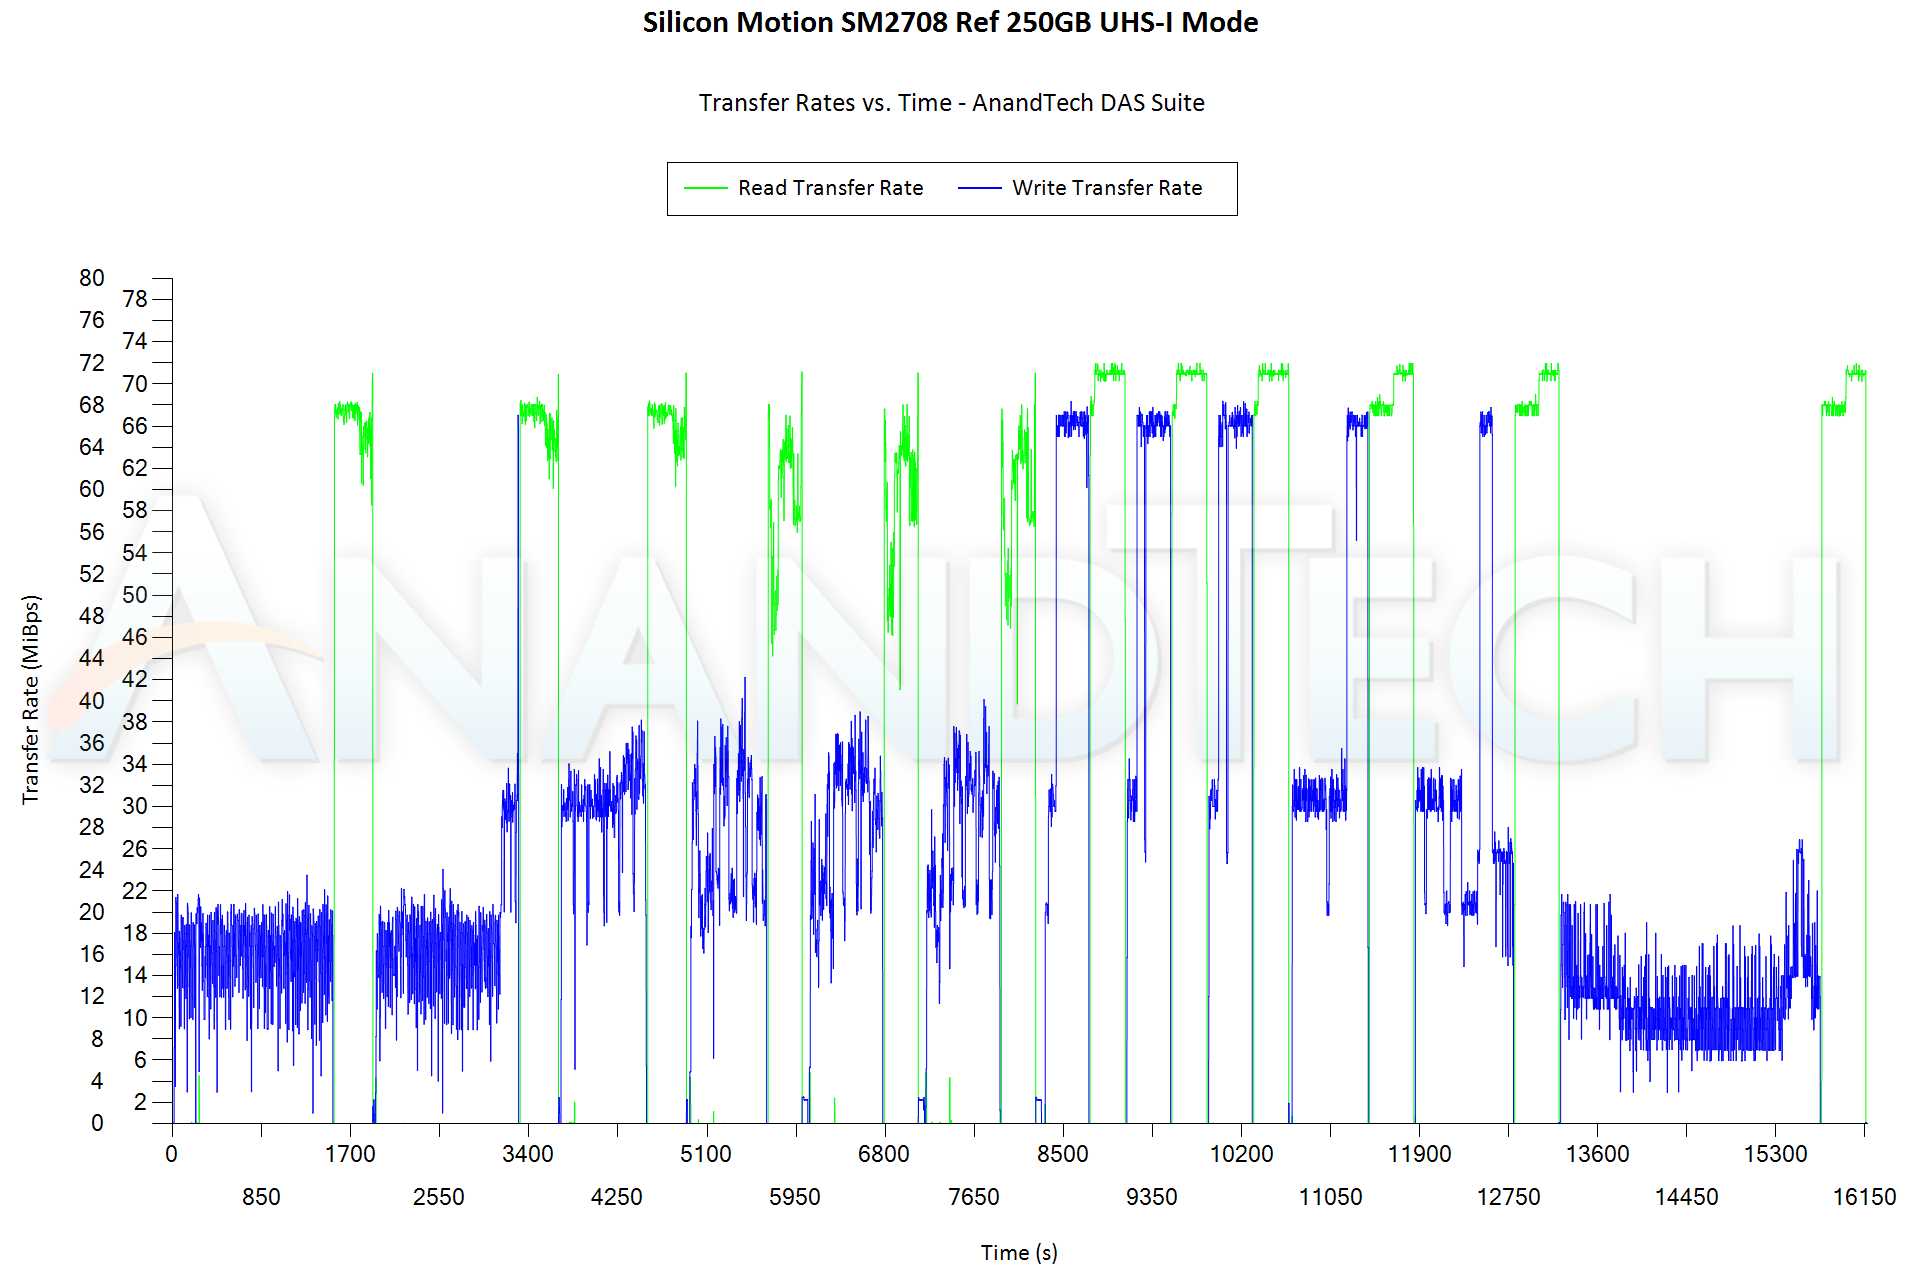
Aspects influencing the performance consistency include SLC caching and thermal throttling / firmware caps on access rates to avoid overheating. This is important for certain use-cases, as the last thing users want see when copying over large amounts of data is the transfer rate going down to USB 2.0 speeds. The graphs below present the recorded instantaneous bandwidth numbers and temperatures (where applicable) while processing the AnandTech DAS Suite
| AnandTech DAS Suite - Performance Consistency | |
| TOP: | BOTTOM: |
 |
|
 |
|
The DAS suite is started soon after the completion of the CrystalDiskMark and fio workloads, and the SLC cache is already exhaused without enough time for complete reclamation. In addition, the time taken by the host to queue up 5.5GB+ of writes is quite small, so we do not even see the SLC caching burst in these workloads. The more worrisome aspect is the temperature - staying at around 99C - 100C throughout the test (temperature monitoring reports 0 in the graph for 100C+ temperatures). We will cover the thermal aspects in detail further down in the review.
PCMark 10 Storage Bench
There are a number of storage benchmarks that can subject a device to artificial access traces by varying the mix of reads and writes, the access block sizes, and the queue depth / number of outstanding data requests. More serious benchmarks, however, actually replicate access traces from real-world workloads to determine the suitability of a particular device for a particular workload. Real-world access traces may be used for simulating the behavior of computing activities that are limited by storage performance. Examples include booting an operating system or loading a particular game from the disk.
PCMark 10's storage bench (introduced in v2.1.2153) includes four storage benchmarks that use relevant real-world traces from popular applications and common tasks to fully test the performance of the latest modern drives:
- The Full System Drive Benchmark uses a wide-ranging set of real-world traces from popular applications and common tasks to fully test the performance of the fastest modern drives. It involves a total of 204 GB of write traffic.
- The Quick System Drive Benchmark is a shorter test with a smaller set of less demanding real-world traces. It subjects the device to 23 GB of writes.
- The Data Drive Benchmark is designed to test drives that are used for storing files rather than applications. These typically include NAS drives, USB sticks, memory cards, and other external storage devices. The device is subjected to 15 GB of writes.
- The Drive Performance Consistency Test is a long-running and extremely demanding test with a heavy, continuous load for expert users. In-depth reporting shows how the performance of the drive varies under different conditions. This writes more than 23 TB of data to the drive.
Despite the data drive benchmark appearing most suitable for testing direct-attached storage, we opt to run the full system drive benchmark as part of our evaluation flow. This allows for simulation of extended usage on the memory card.
The Full System Drive Benchmark comprises of 23 different traces. For the purpose of presenting results, we classify them under five different categories:
- Boot: Replay of storage access trace recorded while booting Windows 10
- Creative: Replay of storage access traces recorded during the start up and usage of Adobe applications such as Acrobat, After Effects, Illustrator, Premiere Pro, Lightroom, and Photoshop.
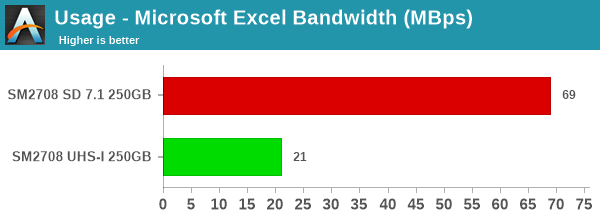
- Office: Replay of storage access traces recorded during the usage of Microsoft Office applications such as Excel and Powerpoint.
- Gaming: Replay of storage access traces recorded during the start up of games such as Battlefield V, Call of Duty Black Ops 4, and Overwatch.
- File Transfers: Replay of storage access traces (Write-Only, Read-Write, and Read-Only) recorded during the transfer of data such as ISOs and photographs.
PCMark 10 also generates an overall score, bandwidth, and average latency number for quick comparison of different drives. The sub-sections in the rest of the page reference the access traces specified in the PCMark 10 Technical Guide.
Booting Windows 10
The read-write bandwidth recorded for each drive in the boo access trace is presented below.
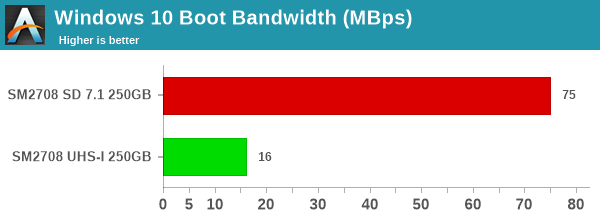
In SD Express mode, the numbers are equivalent to a high-end SATA SSD. This is expected as the boot workload is mostly read-intensive, and the numbers for read workloads are not influenced by the SLC caching effects.
Creative Workloads
The read-write bandwidth recorded for each drive in the sacr, saft, sill, spre, slig, sps, aft, exc, ill, ind, psh, and psl access traces are presented below.
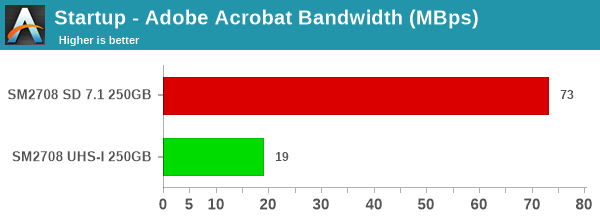
The SD Express card performance is equivalent to that of a 256GB-class SATA SSD in both read- and write-intensive workloads.
Office Workloads
The read-write bandwidth recorded for each drive in the exc and pow access traces are presented below.
Gaming Workloads
The read-write bandwidth recorded for each drive in the bf, cod, and ow access traces are presented below.
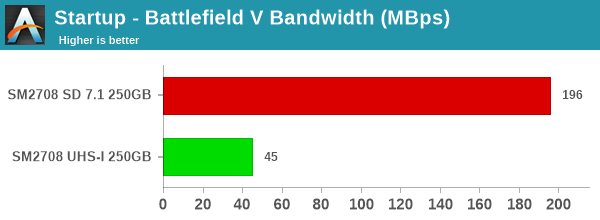
Gaming workloads are read-intensive and the SD Express mode has no problems in delivering results similar to that of high-end SATA SSDs and low-end DRAM-less PCIe 3.0 x2 NVMe SSDs in its performance class.
Files Transfer Workloads
The read-write bandwidth recorded for each drive in the cp1, cp2, cp3, cps1, cps2, and cps3 access traces are presented below.

Simultaneous reads and writes tend to bring down the performance to SATA level for the SD Express mode, but, thanks to the sequential nature of the workloads, the numbers are quite good for a memory card.
Overall Scores
PCMark 10 reports an overall score based on the observed bandwidth and access times for the full workload set. The score, bandwidth, and average access latency for each of the drives are presented below.
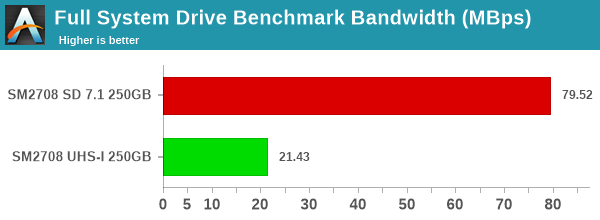
Equivalent numbers for external flash drives can be found in this review featuring both NVMe and SATA SSDs behind a bridge chip. The numbers in the SD Express mode closely track the ADATA SC680 960GB sample - which happens to be a SATA SSD using the Silicon Motion SM2259XT DRAM-less controller but with more flash packages. Given that the reference design sampled to us only uses two packages and has 25% of the capacity (not much parallelism to exploit), it is only the NVMe interface / SD Express operation that allows the memory caard to reach the SC680's performance level.


43 Comments
View All Comments
eastcoast_pete - Thursday, September 9, 2021 - link
Those temperatures and power draws are way too high for what is probably the main use scenario: removable storage in high-resolution handheld cameras. They're also too high for potential use as removable storage, again mainly for video, in future Smartphones, once Android counterparts to Apple's upcoming iPhone Pro Max become available. That can reportedly use ProRes as file format to save videos, and ProRes eats storage space for breakfast.bananaforscale - Thursday, September 9, 2021 - link
Temps are certainly too high, but power draw not necessarily. That peak draw of 4.58W is ~1.1A at 4.2V, so you could power one off a single 18650 cell for a couple of hours assuming peak is constant, which it won't be.Fulljack - Thursday, September 9, 2021 - link
I think it's more intended for state-of-the-art digital camera that output high bitrate, high resolution video. one of the limiting factor are storage speed. having this on what seems like a laptop on your shoulders would help portability a lot.at_clucks - Friday, September 10, 2021 - link
At that point many users simply invest in cameras that output to an external SSD, at least with something like a CFast to SSD adapter.schuckles - Friday, September 10, 2021 - link
Whether these cards are usable as is really depends on your workload. I would have liked to see something like the anadrech light benchmarked and include the MBPS/watt to know how realistic that 4 watt workload is. Also curious what the idle/standby power of the card itself is.PaulHoule - Thursday, September 9, 2021 - link
How much heat could you remove from that kind of thing if you made the exterior out of metal and pressed it between two cold plates with a strong spring? I'd like to give an SDExpress card the same treatment as the "CPU" on an IBM 3090.shelbystripes - Thursday, September 9, 2021 - link
So… CFExpress cards are stupid fast, but get hot just doing sustained read (copying a full 256GB card’s contents to a computer all at once). And this is putting the same thing in an even smaller form factor. Of course the end result is inevitable.For photography this is still valuable, the cards are fast enough even in UHS-I mode for sustained burst in most cameras, and then having PCIe speeds for clearing the contents quickly to a PC is quite handy. But for video… these things will get hot, and compact camera thermals are already a nightmare. The Canon EOS R5 can technically shoot 8K video, but do it for very long and the damn thing overheats. The more you add awful thermal properties inside a compact environment like that, the worse off you are…
spaceship9876 - Thursday, September 9, 2021 - link
you forgot to mention ufs cards.Einy0 - Thursday, September 9, 2021 - link
Wow, 96C that will leave a mark!Kamen Rider Blade - Thursday, September 9, 2021 - link
When are regular sized SD cards going to go up in size?1TB Micro SD Cards already exists.
I calculate that if you make optimal use of the physical space of a SD card, you can get 4.5 TiB of storage using existing 512 GiB Nand Flash cells.
Wouldn't you want an entire regular sized SD card with 4.5 TiB of storage?