The ADATA GAMMIX S50 Lite 2TB SSD Review: Mainstream PCIe Gen4
by Billy Tallis on April 30, 2021 8:00 AM ESTBurst IO Performance
Our burst IO tests operate at queue depth 1 and perform several short data transfers interspersed with idle time. The random read and write tests consist of 32 bursts of up to 64MB each. The sequential read and write tests use eight bursts of up to 128MB each. For more details, please see the overview of our 2021 Consumer SSD Benchmark Suite.
 |
|||||||||
| Random Read | Random Write | ||||||||
| Sequential Read | Sequential Write | ||||||||
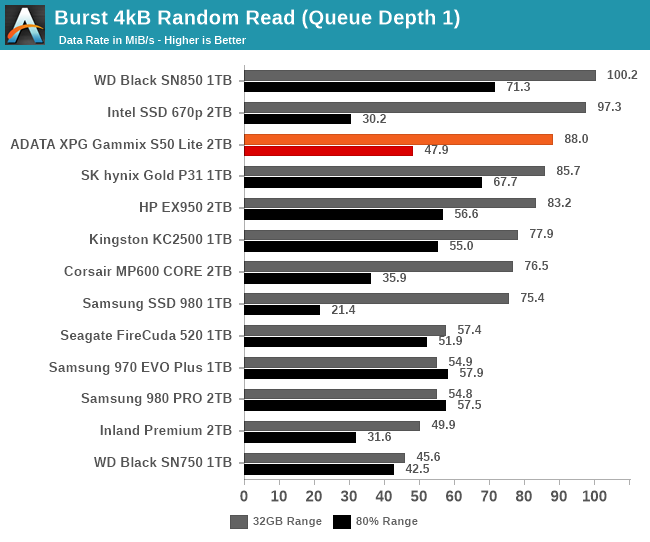
The ADATA XPG Gammix S50 Lite performs well on most of the burst IO tests, especially when the test is confined to a narrow range of the drive so that it won't overflow the SLC and DRAM caches. When the test ranges over 80% of the drive, the S50 Lite's write speeds are much lower (due to less available SLC cache) and the random read performance is also a bit lower (due to insufficient DRAM).
Sustained IO Performance
Our sustained IO tests exercise a range of queue depths and transfer more data than the burst IO tests, but still have limits to keep the duration somewhat realistic. The primary scores we report are focused on the low queue depths that make up the bulk of consumer storage workloads. For more details, please see the overview of our 2021 Consumer SSD Benchmark Suite.
 |
|||||||||
| Random Read | Throughput | Power | Efficiency | ||||||
| Random Write | Throughput | Power | Efficiency | ||||||
| Sequential Read | Throughput | Power | Efficiency | ||||||
| Sequential Write | Throughput | Power | Efficiency | ||||||
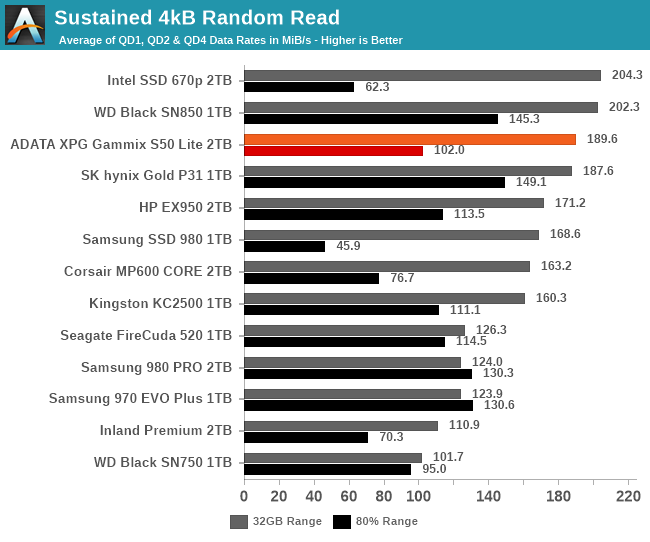
Adding in some slightly higher queue depths and longer test durations doesn't substantially change how the S50 Lite ranks. Its peak performance is still competitive with the best PCIe Gen3 drives, but as the drive fills up and the locality of the workload drops, it loses more performance than those 8-channel Gen3 drives with the full amount of DRAM.
The power efficiency score on these tests generally look better for the S50 Lite than the energy usage scores from the ATSB tests. Its efficiency is generally at least middle-of-the-road except in the situations where performance starts seriously dropping.
 |
|||||||||
| Random Read | |||||||||
| Random Write | |||||||||
| Sequential Read | |||||||||
| Sequential Write | |||||||||
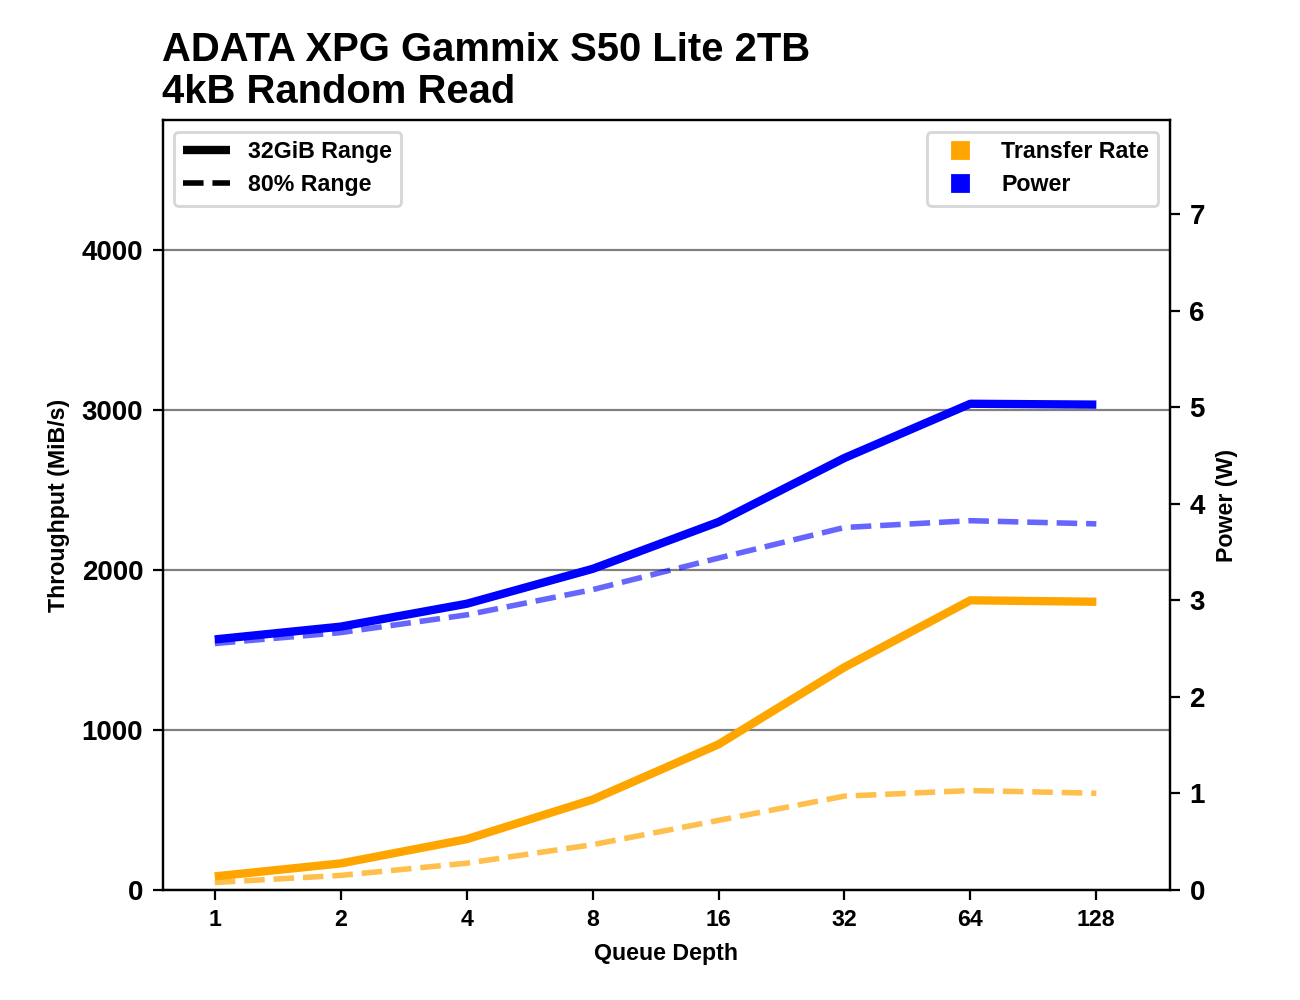
Looking across the full range of queue depths shows the same performance patterns for the S50 Lite continuing and amplifying. Except on the sequential read test, the S50 Lite shows huge performance disparities between the narrow 32GB range test runs and those that cover 80% of the drive. The lower DRAM ratio is a handicap on the random read test, and the SLC cache often overflows when testing writes against an 80% full drive. But when the tests are only covering a small slice of the drive, the S50 Lite shows good performance scaling that is comparable to the best gen3 drives.
Random Read Latency
This test illustrates how drives with higher throughput don't always offer better IO latency and Quality of Service (QoS), and that latency often gets much worse when a drive is pushed to its limits. This test is more intense than real-world consumer workloads and the results can be a bit noisy, but large differences that show up clearly on a log scale plot are meaningful. For more details, please see the overview of our 2021 Consumer SSD Benchmark Suite.
 |
|||||||||
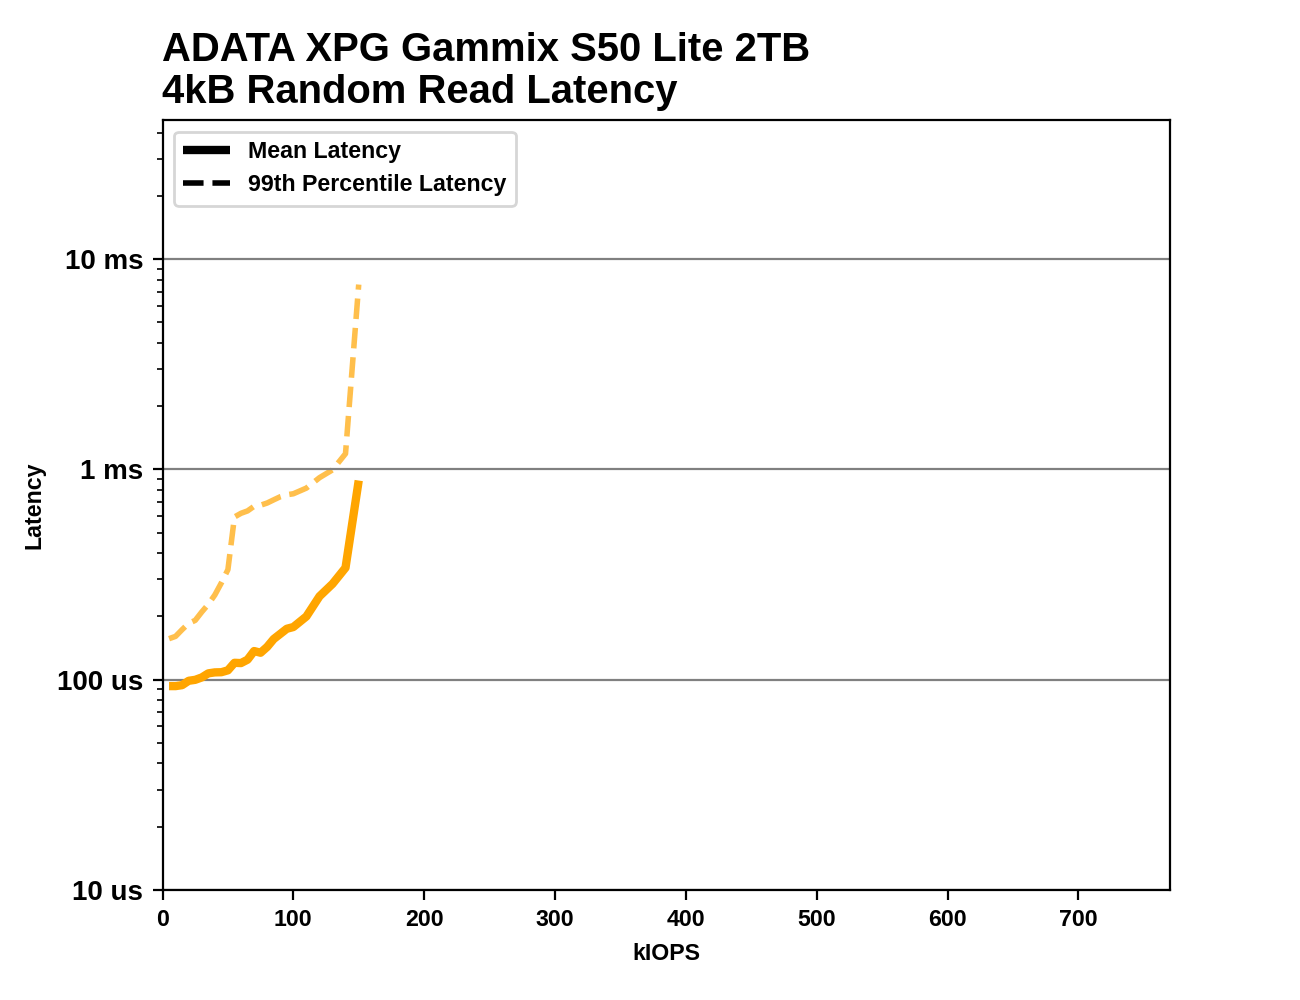
The ADATA S50 Lite starts out with decent random read latency at low loads, but the 99th percentile latencies climb quite a bit during the early part of the test. The S50 Lite ultimately fails to make it to the high IOPS range we expect from such a drive, and instead loses control of its latency around 150k IOPS—behavior that's more fitting of a QLC drive.


93 Comments
View All Comments
yannigr2 - Friday, April 30, 2021 - link
Years are passing by and the cost per GB is moving up instead of down.deil - Friday, April 30, 2021 - link
but speeds go up a lot. if you compare those to 60GB ssd's of 2005'ish those are 100x fasterStrangerGuy - Sunday, May 2, 2021 - link
Obviously he implies recent price trends in a market where some older products are clearly better then new ones not only in performance/$ but also in absolute performance.But sure please keep up your disingenuous trollish comparisons. Maybe you would also want to elaborate how current GPUs aren't overpriced because they are a million times faster than the 1998 TNT?
TheinsanegamerN - Thursday, May 6, 2021 - link
Take a chill pill dude. You still get way more bang for your buck on sSDs now then you did 3-4 years ago. 4-8TB m.2 drives wern't even an option back then, and PCIe gen 4 is expensive to implement compared to gen 3.Also current GPUs are no more overpriced then the 8800ultra was, which adjusted for inflation was $1100, with NO mining excuses. Didnt even have 1GB of RAM FFS.
Linustechtips12#6900xt - Friday, April 30, 2021 - link
well I think part of that is due to the chip shortage currently but i do agree, things like the intel 660p ssd are a great example of nand prices going down and for the btter a 1tb 90$ ssd, AMAZING as far as im concerned and most notebooks use ssds rather than hard drives, prices havent really gone up much for that super amazing benefit.Oxford Guy - Friday, April 30, 2021 - link
Part of that is the fact that QLC actively works against consumer value, by reducing the economy of scale cost-reduction benefit for TLC.People are literally giving themselves an arrow to the knee when they buy QLC.
Billy Tallis - Friday, April 30, 2021 - link
You keep posting this comment on every article about storage, but that doesn't make it true. Your notion of "economy of scale" is pathetically naive and unconnected to the reality of how NAND flash memory is manufactured. Economies of scale in semiconductor manufacturing come primarily from having more and larger fabs. Using two different mask sets with those production lines instead of just one doesn't ruin those economies of scale. If it did, then you should have been complaining about companies manufacturing both 256Gbit and 512Gbit TLC dies at the same time.Oxford Guy - Friday, April 30, 2021 - link
Calling my argument 'pathetically naive' doesn't make your opinions true either.'Economies of scale in semiconductor manufacturing come primarily from having more and larger fabs. Using two different mask sets with those production lines instead of just one doesn't ruin those economies of scale.'
The reality is that every dollar consumers spend on QLC is a dollar less spent on TLC. That reduces the economy of scale for TLC by reducing TLC production.
Billy Tallis - Saturday, May 1, 2021 - link
"The reality is that every dollar consumers spend on QLC is a dollar less spent on TLC. That reduces the economy of scale for TLC by reducing TLC production."You have no basis for believing that adding some QLC to the mix of a NAND fab's output meaningfully affects the marginal cost of TLC production. I've never seen you hypothesize any mechanism for how that would actually work. You just keep asserting a general economic principal as if it's a fundamental law.
Oxford Guy - Tuesday, May 4, 2021 - link
You are trying to make this seem complex when it's extremely simple.As we have already seen with SLC and MLC, when a cheaper-to-produce technology comes along, production shifts to producing that technology -- reducing availability of the previous products. (That was a serious drawback for consumers before 3D manufacturing made TLC a much better solution than it was.) Scarcity + demand = higher prices. Reducing production increases scarcity. Eventually, it also generally reduces demand which, in turn, reduces production further.
We have already seen this with MLC. It's rather incredible to see anyone claim there is no evidence of exactly the process I've described. It's also extremely simple, and factual, that every dollar spent on QLC is a dollar not spent on TLC -- nor MLC.