vApus Mark I: Performance-Critical Applications Virtualized
If you have virtualized your datacenter a while ago, chances are that the light loads are already virtualized. What is next? Well, if you have been following the virtualization scene, you’ll know that the virtualization vendors are very actively promoting that you should virtualize your performance-critical applications. vSphere 4 allows you to use up to 8 vCPUs and up to 255 GB of RAM, Xenserver 8 vCPUs and 32 GB RAM. Hyper-V is still lagging with only 4 vCPUs and a maximum of 16 CPUs (24 with the “Dunnington” hotfix”) per host. But that will change in Hyper-V R2. Bottom line is, it is getting attractive to virtualize “heavy duty” applications too. If only to be able to migrate them (“Vmotion”, “Xenmotion”, “Live Migration”) or manage them more easily.
- RVI and EPT are enabled on all VMs if possible
- HT-Assist is off, unless indicated otherwise
vApus Mark I uses four VMs with four server applications:
- A SQL Server 2008 x64 database running on Windows 2008 64-bit, stress tested by our in-house developed vApus software.
- Two heavy-duty MCS eFMS portals running PHP, IIS on Windows 2003 R2, stress tested by our in-house developed vApus software.
- One OLTP database, based on the Oracle 10G Calling Circle benchmark of Dominic Giles.
The beauty is that vApus (stresstesting software developed by the Sizing Servers Lab) uses actions made by real people (as can be seen in logs) to stresstest the VMs, not some benchmarking algorithm. First we look at the results in ESX 3.5 Update 4, at the moment the most popular hypervisor.
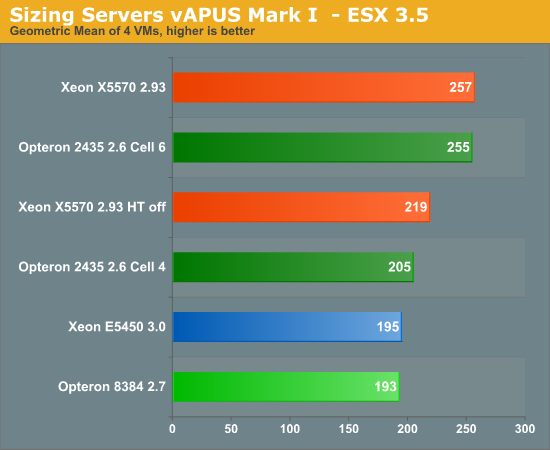
If you just plug Istanbul into your virtualized server, you can't tell if you're running with a six-core or quad-core. You might remember from our previous article that a 2.9 GHz 2389 scored 203. Pretty dissapointing that six cores at 2.6 GHz equals 4 cores at 2.9 GHz. What went wrong? By default, the VMware ESX 3.5 scheduler logically partitions the available cores into groups of four, called “Cells”. The objective is to schedule VM’s always on the same cell, thereby making sure that the VM’s stay in the same node and socket. This should make sure that the VM always uses local memory (instead of needing remote memory of another node) and more importantly that the caches stay “warm”. If you use the default cell size of 4 cores, one or more VM’s will be split among two sockets with lots of traffic going back and forth. Once we increase the cell size from 4 to 6 (see VMware’s knowledge base), the ugly duck becomes a swan. The six-core Opteron keeps up with the best Xeons available!
The Xeon x55xx is however somewhat crippled in this case, as ESX 3.5 update 4 does not support EPT and does not make optimal use of HyperThreading. You can see from our measurements above that hyperthreading improves the score by about 17%. According to our OEM sources, VMmark improves by up to 30% on ESX 4.0. This shows that ESX 4.0 makes better use of HyperThreading. So let us see some ESX 4.0 numbers!
| Reference | 175.3 |
45.8 |
45.8 |
155.3 |
| Server System Based On | OLAP VM | Webportal VM2 | Webportal VM3 | OLTP VM |
| Dual Xeon X5570 2.93 | 103% | 50% | 51% | 95% |
| Dual Opteron 2435 2.6 | 91% | 43% | 43% | 90% |
| Dual Opteron 2377 2.3 | 82% | 36% | 35% | 53% |
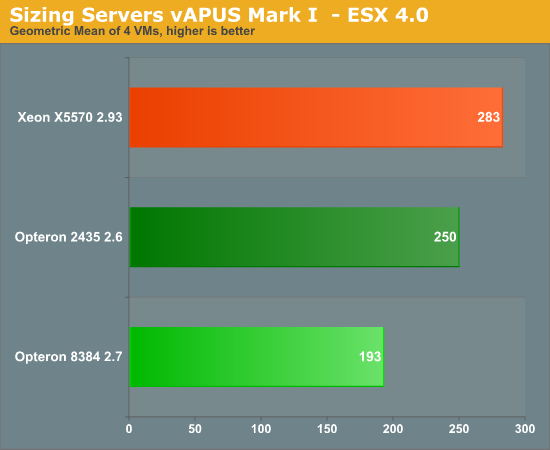
The Nehalem-based Xeon moves forward, but does not make a huge jump. Performance of the six-core Opteron was decreased by 2%, which is inside the error margin of this benchmark. It is still an excellent result for the latest Opteron: this results means it will have no trouble competing with the 2.66 Ghz Xeon X5550. VMmark tells us that the latest Xeon “Nehalem” starts to shine when you dump huge amounts of VM on top of the server. So we decided to test with 8 VM’s. It is very unlikely that you will consolidate more than 10 Performance-Critical applications on top of one physical server, so we feel that 8 VM’s should tell the whole story. We changed only one thing: we decreased the amount of memory to the webportals from 4 to 2 GB, to make sure that the benchmark fits within the maximum of 24 GB that we had on the Xeon X5570. To keep things readable, we have made an average of each 2 identical VM’s (so OLAP VM = (OLAP VM1 + OLAP VM5)/2).
| Reference | 175.3 |
45.8 |
45.8 |
155.3 |
| Server System Based On | OLAP VM | Webportal VM2 | Webportal VM3 | OLTP VM |
| Dual Xeon X5570 2.93 | 79% | 34% | 32% | 47% |
| Dual Opteron 2435 2.6 | 71% | 23% | 23% | 38% |
| Dual Opteron 2377 2.3 | 76% | 19% | 19% | 28% |
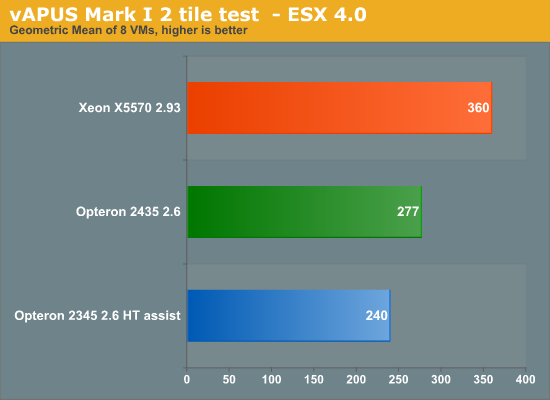
Notice that HT-assist is a performance killer in 2P configurations: you remove two times 1 MB of L3-cache, which is a bad idea with 8 VM’s hitting your two CPUs. It is interesting to see that the Xeon X5570 starts to break away, as we increase the number of VM’s. The Xeon X5570 is about 30% faster than the Dual Opteron 2435. It gives us a clue why the VMmark scores are so extreme: the huge amount of VM’s might overemphasize world switch times for example. But even with light loads, it is very rare to find more than 20 VM’s on top of DP processor.
There is more. In the 2-tile test the ESX scheduler has to divide 16 logical CPU’s among 32 vCPU’s. That is a lot easier than dividing 12 physical CPUs among 32 vCPU’s. This might create coscheduling issues on the six-core Opteron.
So our 2-tile test was somewhat “biased” towards the Xeon X5570.
We reduced the number of vCPUs on the webportal VMs from 4 to 2. That means that we have:
- Two times 4 vCPUs for the OLAP test
- Two times 4 vCPUs for the OLTP test
- Two times 2 vCPUs for the OLTP test
Or a total of 24 vCPU’s. This test is thus biased towards the “Istanbul” processor. Remember that our reference score was based on a 4 CPU “native” score. So we adjusted the reference score of webportals to one that was obtained with 2 native CPU’s. The reference score for the OLTP and OLAP test remained unchanged. The results below are not comparable with the ones you have seen so far. It is an experiment to understand our scores better. To keep things readable, we have made an average of each 2 identical VM’s (so OLAP VM = (OLAP VM1 + OLAP VM5)/2).
| Reference | 175.3 |
45.8 |
45.8 |
155.3 |
| Server System Based On | OLAP VM | Webportal VM2 | Webportal VM3 | OLTP VM |
| Dual Xeon X5570 2.93 | 82% | 53% | 53% | 43% |
| Dual Opteron 2435 2.6 | 81% | 38% | 38% | 44% |
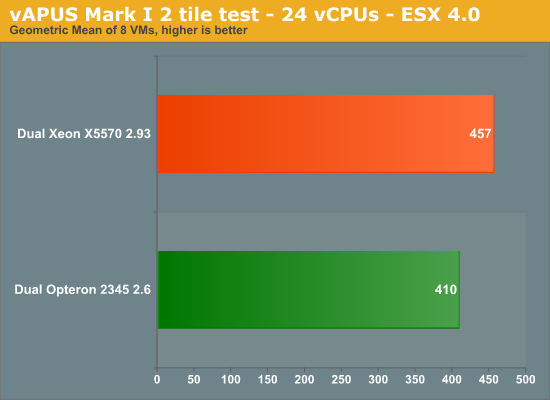
The result is that the Xeon Nehalem is once again only 11% faster. So it is important to remember that relation between the number of vCPU’s and the Cell size is pretty important when you are dealing with MP virtual machines. We expect that the number of VM’s with more than one vCPU will increase as time goes by.


40 Comments
View All Comments
iocedmyself - Wednesday, June 17, 2009 - link
Well something that was failed to be mentioned was that the 2P opteron machine costs about $6700, where as the nehalem 2p machine is very near to $16,000.as for power consumption a straight up comparison would be HP380 Xeon and HP 385 Opteron. At idle, both are 140W. With 100% CPU / Ram, 385 is around 300W, 380 (Xeon) is about 450W.
another thing not discussed here - 4P Istanbul is 70-80% faster than 2P Nehalem, and there is no 4P Nehalem. 8P Istanbul is over 3 times as fast as 2P Nehalem. so until next gen Nehalem, there is no competition in the high end which probably has something to do with istanbul orders being through the roof.
I also have to wonder if these benchmarks were conducted using one of Intel's little helpful optimized compilers.
yasbane - Wednesday, June 10, 2009 - link
would be nice to see some unix or linux benchmarks...riskyburden - Thursday, June 4, 2009 - link
I might be naive here but surely the majority of these applications are favouring clock speed and no more than two cores, should there not be a bench for those companies that run multiple apps such as SQL and AD or IPFX etc all from one server and make a comparison there. I don't suggest it to be good network practice but that would interest me more.mino - Friday, June 5, 2009 - link
For this part of SMB market pretty much any dual core CPU will do.Their bottleneck is almost allways on the storage side, sometimes with insufficient memory.
And most also run default install where basic SW tweaks would make 100's percents in performance.
befair - Wednesday, June 3, 2009 - link
Johan never proves me wrong. Even an article meant to talk about AMD Opteron starts with a good deal of "Intel is the king!" stuff, as usual.alpha754293 - Wednesday, June 3, 2009 - link
What happened to them?I would have to loved to have seen what the new 6-core AMDs would be able to do in this arena since it is (presumably) a much more competitive offering than the fastest Xeons all around.
lopri - Tuesday, June 2, 2009 - link
A Question: Is the 'snoop-filter' a hardware-based? I read that it can be enabled/disabled via BIOS, and since the cores are same as Shanghai cores.. But my question is, whether it's hardware-based or software-based (BIOS), shouldn't this work for inter-core communication as well if AMD decides to implement it?JohanAnandtech - Tuesday, June 2, 2009 - link
I have to check, but I am pretty sure it is both. The "uncore" part has changed somewhat on Istanbul."shouldn't this work for inter-core communication as well if AMD decides to implement it"
Since the L3-cache keeps copies of shared L2-cachelines, I don't think that will help. There is already a very fast way of communicating with little overhead.
tygrus - Monday, June 1, 2009 - link
I would like to know the performance difference when using a cell size of 3 not 6 on the 6-core units or of 8 not 4 on Xeon 4Core8Thread ?Will have to wait for latter for more raw performance numbers (eg. memory local/system, SPEC CPU, task switching, OS/IO task servicing).
How long before they update the boards for DDR3 based memory and better IO onboard ?
It's a pity the ESX 4.0 update hasn't helped AMD .. are the improvements only available for Intel or was it to correct a previous Intel only problem ? What can AMD/partners do to improve performance ?
JohanAnandtech - Tuesday, June 2, 2009 - link
"I would like to know the performance difference when using a cell size of 3 not 6 on the 6-core units?"A cell size of 3 will not do any good if your VMs are MP. Eventhough ESX features "relaxed co-scheduling", there might quite a few cases where the Scheduler is not able to use all "slots" as some of vCPUs of the VMs might be behind. From the momemt you use more than 2 vCPUs, you will get situations where only one VM with 2 CPUs is scheduled on a cell of 3 CPUs. 8-cell: I have to try it.
"How long before they update the boards for DDR3 based memory and better IO onboard ? "
The AMD's Fiorano platform that will be available in a few weeks should have better I/O (PCIe gen 2) but will still be DDR-2 based.
DDR-3 CPUs are scheduled for 2010.
"It's a pity the ESX 4.0 update hasn't helped AMD .. are the improvements only available for Intel or was it to correct a previous Intel only problem ? "
VMware's docs tell us they that CPU locking goes more quickly and that the scheduler is "cache aware", but most of the biggest improvements are EPT and better support for Hyperthreading.