Gemini Lake SFF PC Showdown: Intel's June Canyon (NUC7PJYH) and ECS's LIVA Z2 Reviewed
by Ganesh T S on December 20, 2018 8:00 AM ESTMiscellaneous Performance Metrics
This section looks at some of the other commonly used benchmarks representative of the performance of specific real-world applications.
3D Rendering - CINEBENCH R15
We use CINEBENCH R15 for 3D rendering evaluation. The program provides three benchmark modes - OpenGL, single threaded and multi-threaded. Evaluation of different PC configurations in all three modes provided us the following results.
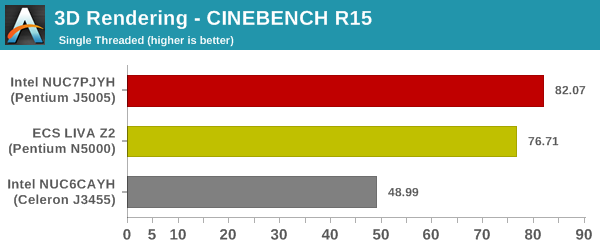
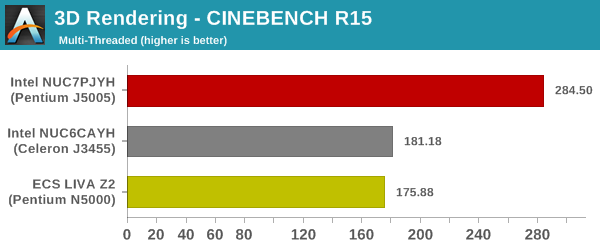
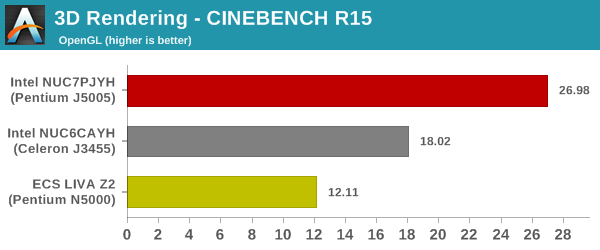
The ECS LIVA Z2 suffers a bit in the OpenGL case, but, is neck and neck with the Arches Canyon NUC in the multi-threaded, and far ahead in the single-threaded case.
x265 Benchmark
Next up, we have some video encoding benchmarks using x265 v2.8. The appropriate encoder executable is chosen based on the supported CPU features. In the first case, we encode 600 1080p YUV 4:2:0 frames into a 1080p30 HEVC Main-profile compatible video stream at 1 Mbps and record the average number of frames encoded per second.
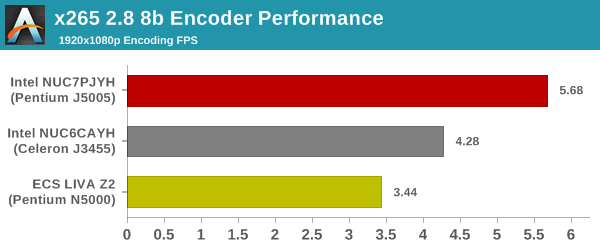
Our second test case is 1200 4K YUV 4:2:0 frames getting encoded into a 4Kp60 HEVC Main10-profile video stream at 35 Mbps. The encoding FPS is recorded. Unfortunately, both Gemini Lake systems were unable to complete this benchmark, exiting abruptly in the middle. The Arches Canyon encoded the 4K stream at 0.36 fps.
7-Zip
7-Zip is a very effective and efficient compression program, often beating out OpenCL accelerated commercial programs in benchmarks even while using just the CPU power. 7-Zip has a benchmarking program that provides tons of details regarding the underlying CPU's efficiency. In this subsection, we are interested in the compression and decompression rates when utilizing all the available threads for the LZMA algorithm.
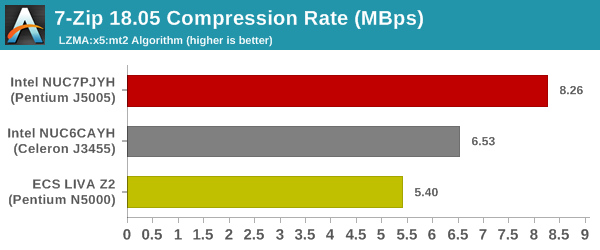
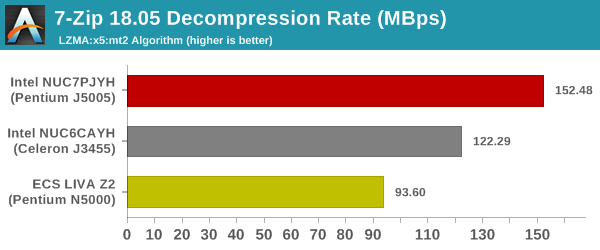
In addition to the CPU, the RAM also plays a role here. ECS's decision to equip only one of the two SODIMM slots with RAM could be the culprit here.
Cryptography Benchmarks
Cryptography has become an indispensable part of our interaction with computing systems. Almost all modern systems have some sort of hardware-acceleration for making cryptographic operations faster and more power efficient. In this sub-section, we look at two different real-world applications that may make use of this acceleration.
BitLocker is a Windows features that encrypts entire disk volumes. While drives that offer encryption capabilities are dealt with using that feature, most legacy systems and external drives have to use the host system implementation. Windows has no direct benchmark for BitLocker. However, we cooked up a BitLocker operation sequence to determine the adeptness of the system at handling BitLocker operations. We start off with a 2.5GB RAM drive in which a 2GB VHD (virtual hard disk) is created. This VHD is then mounted, and BitLocker is enabled on the volume. Once the BitLocker encryption process gets done, BitLocker is disabled. This triggers a decryption process. The times taken to complete the encryption and decryption are recorded. This process is repeated 25 times, and the average of the last 20 iterations is graphed below.
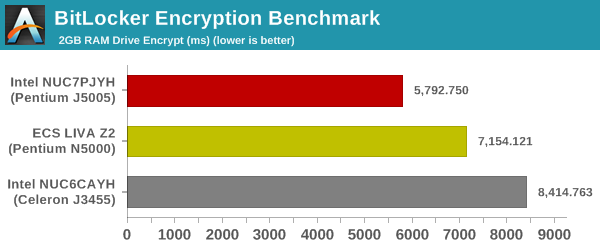
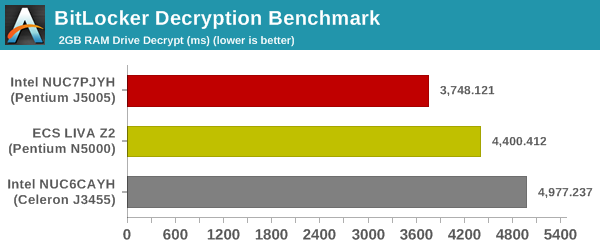
Since all the considered CPUs have AES-NI capabilities, the above benchmark is representative of the sustainable clock speed and also the RAM characteristics.
Creation of secure archives is best done through the use of AES-256 as the encryption method while password protecting ZIP files. We re-use the benchmark mode of 7-Zip to determine the AES256-CBC encryption and decryption rates using pure software as well as AES-NI. Note that the 7-Zip benchmark uses a 48KB buffer for this purpose.
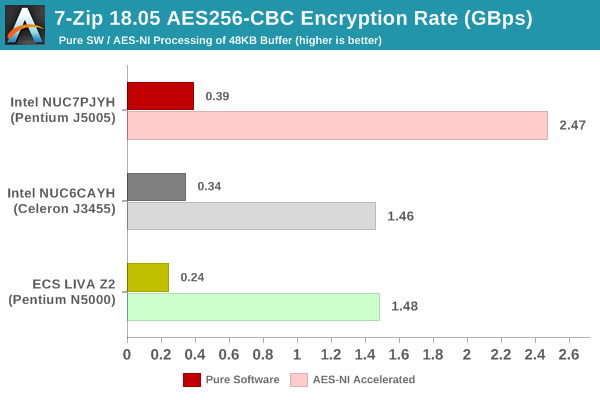
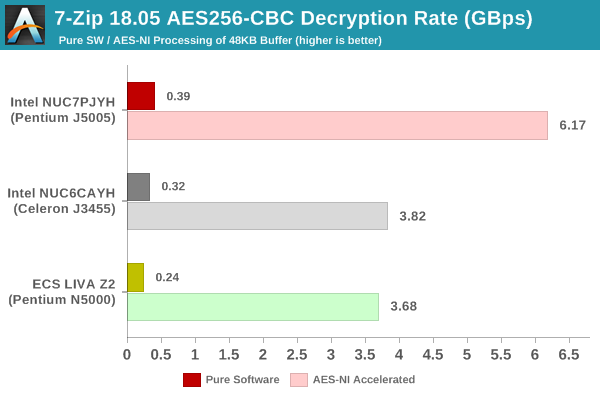
This shows that the relative numbers are similar to the ones observed in other benchmarks.
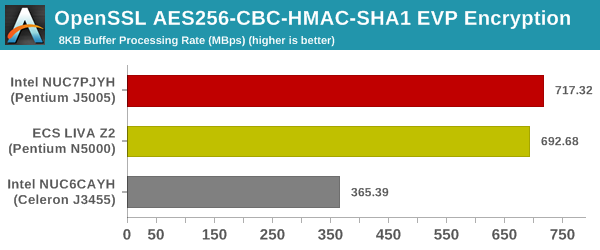
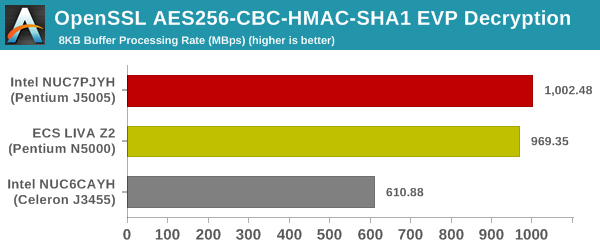
Yet another cryptography application is secure network communication. OpenSSL can take advantage of the acceleration provided by the host system to make operations faster. It also has a benchmark mode that can use varying buffer sizes. We recorded the processing rate for a 8KB buffer using the hardware-accelerated AES256-CBC-HAC-SHA1 feature.
Agisoft Photoscan
Agisoft PhotoScan is a commercial program that converts 2D images into 3D point maps, meshes and textures. The program designers sent us a command line version in order to evaluate the efficiency of various systems that go under our review scanner. The command line version has two benchmark modes, one using the CPU and the other using both the CPU and GPU (via OpenCL). We present the results from our evaluation using the CPU mode only. The benchmark (v1.3) takes 84 photographs and does four stages of computation:
- Stage 1: Align Photographs (capable of OpenCL acceleration)
- Stage 2: Build Point Cloud (capable of OpenCL acceleration)
- Stage 3: Build Mesh
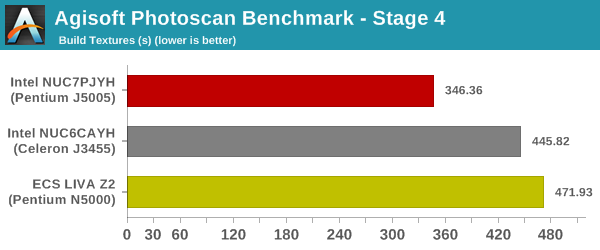
- Stage 4: Build Textures
We record the time taken for each stage. Since various elements of the software are single threaded, and others multithreaded, it is interesting to record the effects of CPU generations, speeds, number of cores, and DRAM parameters using this software.
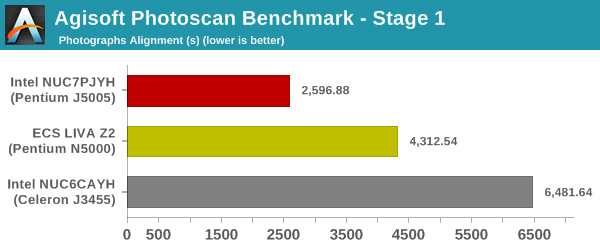
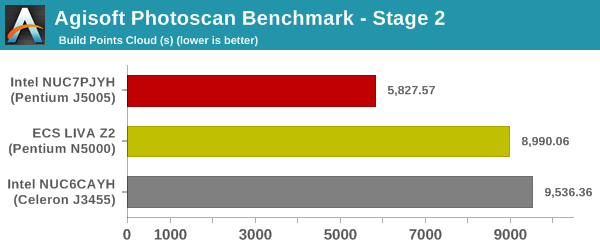
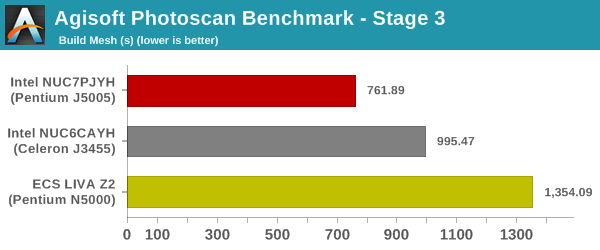
Stage 3 is likely memory performance-limited, unlike the first two stages that are reflective of the single-threaded performance capabilities.
Dolphin Emulator
Wrapping up our application benchmark numbers is the new Dolphin Emulator (v5) benchmark mode results.
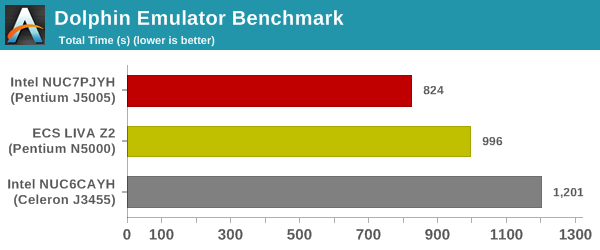
This is again a test of the CPU capabilities, and the ordering expected based on the previous results is seen here too.


59 Comments
View All Comments
IntelUser2000 - Friday, December 21, 2018 - link
Well, the Gemini Lake SoC doesn't have gigabit LAN integrated. Since Gemini Lake integrates the chipset, it would have to be part of the chipset. Gigabit LAN might be too big for such a small die part.In their Core CPU platforms, the Gigabit LAN is in the separate chipset.
mode_13h - Friday, December 21, 2018 - link
Gigabit is like a million years old. There's no way it's too big.And the reason their desktop chips relegate it to South Bridge is because it doesn't *need* to be wasting space and I/O pins in the CPU. Especially since the board designer might decide to go with 10 Gig or whatever, instead.
coreai - Thursday, December 20, 2018 - link
J5005 on intel website shows max memory of 8GB yet you have installed 2x16GB... what’s the catch ?Death666Angel - Thursday, December 20, 2018 - link
You'd have to ask Intel. I have an Atom D2550 NAS that officially only supports 4GB. But I have 8GB installed without issues as have many others (Thecus N5550) My guess is that Intel doesn't want to impede on their lower end Core products with these Atom derived ones.ganeshts - Thursday, December 20, 2018 - link
That is funny, because I specifically installed 32GB just to show them that the spec was wrong :)Gemini Lake NUC has no issues supporting up to 32GB of RAM.
nandnandnand - Thursday, December 20, 2018 - link
So when is AMD going to get itself into one of these?HStewart - Thursday, December 20, 2018 - link
Never: Especially from Intel - but Intel has one with GPU integrated - but never with CPU.Does AMD have a super low power low cost chip like the Atom series. (Pentium)
RSAUser - Friday, December 21, 2018 - link
AMD has Athlone and I expect they will release truly low power with 7nm.mode_13h - Friday, December 21, 2018 - link
Oops, wrong again.https://www.anandtech.com/show/13053/sapphire-unve...
Real Ryzen cores should run circles around Goldmont+, and even a 3 CU Vega should stand up well to Intel's 18 EU HD Graphics (192 shaders vs. 144). Configurable TDP down to 12 W is comparable to the J5005's 10 W.
drzzz - Thursday, December 20, 2018 - link
The configuration comparison table on the first page is broken. It only shows the J5005 config for all possible choices in the right column. The J5005 is configured with what Intel says is an unsupported dimm size which begs the question how is this working? Actually the Pentium N5000 is also limited according to Intel to 8GB dimm modules. What is going on and why should I accept these results as valid if the configurations are not officially supported by Intel? No guarantee the unit I receive would be able to use 16GB modules and no guarantee it will perform like these test units. Disappointed by this article and the testing methodology used.