The iPhone 12 & 12 Pro Review: New Design and Diminishing Returns
by Andrei Frumusanu on November 30, 2020 8:30 AM EST- Posted in
- Mobile
- Apple
- Smartphones
- Apple A14
- iPhone 12
- iPhone 12 Pro
GPU Performance & Power
GPU performance of the new A14 is something that wasn’t very clearly presented during the launch of the new iPhone 12 series. Apple had first introduced the A14 within the new iPad series where it had promised performance increases relative to the A12, not the previous generation A13, and with a bit of math this resulted into a translated 8.3% generational increase which is rather smaller than we had expected given Apple’s recent GPU trajectory over the years. Furthermore, this was also the first release where Apple compared itself to the Android SoC competition which is something the company doesn’t usually do. All these factored into some rather low expectations for the GPU of the A14 – so let’s see how that pans out in practice:
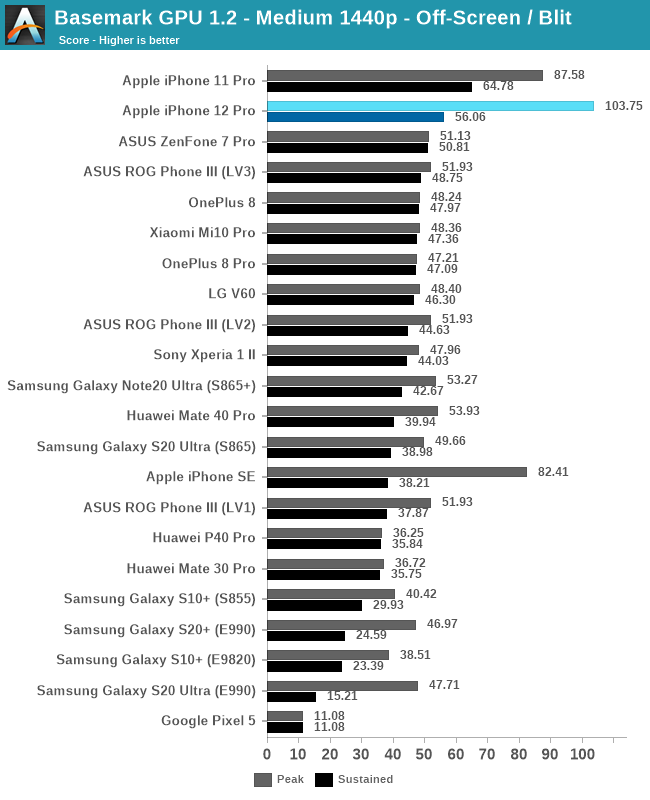
Starting off with Basemark GPU 1.2, we’re seeing a 17% increase in peak performance relative to the iPhone 11 Pro and the A13 chip, which is a nice upgrade, but doesn’t tell the whole story. In the sustained performance figure after 30 minutes of running and when the phone reaches a thermal equilibrium, we see a 45% drop in performance. In this instance, it looks like the iPhone 12 Pro reached a lower sustained performance level than the iPhone 11 Pro which isn’t a great start, but that might change with differing workloads.
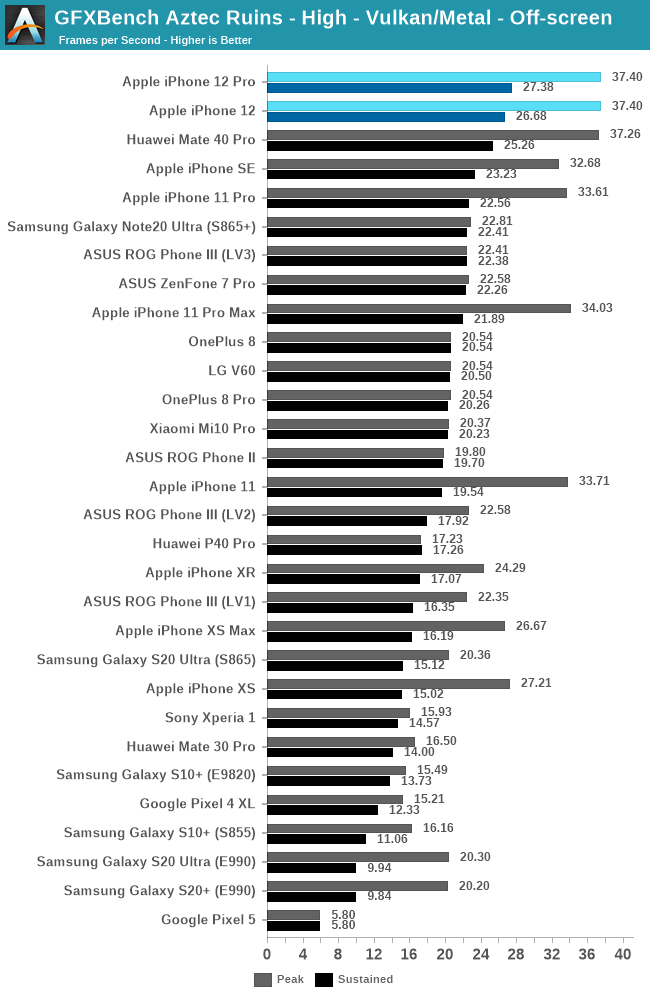
In the Aztec High test, the iPhone 12’s fare a bit better in their sustained performances, with the new chip showing a 21% increase in performance generationally. The peak performance figure is only 11% higher but generally this isn’t the figure that is important for gaming experiences on iPhones.
| GFXBench Aztec High Offscreen Power Efficiency (System Active Power) |
||||
| Mfc. Process | FPS | Avg. Power (W) |
Perf/W Efficiency |
|
| iPhone 12 Pro (A14) 🔥 Throttled | N5 | 28.36 | 3.91 | 7.24 fps/W |
| iPhone 11 Pro (A13) 🔥 Throttled | N7P | 26.14 | 3.83 | 6.82 fps/W |
| iPhone 12 Pro (A14) ❄️ Peak | N5 | 37.40 | 5.57 | 6.64 fps/W |
| iPhone 11 Pro (A13) ❄️ Peak | N7P | 34.00 | 6.21 | 5.47 fps/W |
| Galaxy S20 Ultra (Snapdragon 865) | N7P | 20.35 | 3.91 | 5.19 fps/W |
| Mate 40 Pro (Kirin 9000) 🔥 Throttled | N5 | 27.37 | 5.39 | 5.07 fps/W |
| iPhone XS (A12) 🔥 Throttled | N7 | 19.32 | 3.81 | 5.07 fps/W |
| Reno3 5G (Dimensity 1000L) | N7 | 11.93 | 2.39 | 4.99 fps/W |
| iPhone XS (A12) ❄️ Peak | N7 | 26.59 | 5.56 | 4.78 fps/W |
| Mate 40 Pro (Kirin 9000) ❄️ Peak | N5 | 37.22 | 8.53 | 4.36 fps/W |
| ROG Phone III (Snapdragon 865+) | N7P | 22.34 | 5.35 | 4.17 fps/W |
| Mate 30 Pro (Kirin 990 4G) | N7 | 16.50 | 3.96 | 4.16 fps/W |
| Galaxy S20+ (Exynos 990) | 7LPP | 20.20 | 5.02 | 3.59 fps/W |
| Galaxy S10+ (Snapdragon 855) | N7 | 16.17 | 4.69 | 3.44 fps/W |
| Galaxy S10+ (Exynos 9820) | 8LPP | 15.59 | 4.80 | 3.24 fps/W |
Looking at the power consumption of the new phones, we see again that both the peak and throttled performance figures of the new chip isn’t all that much different to the previous generation, as we’re seeing roughly 8% better performance at almost the same power envelope of around 3.9W. The peak power figure of the new chip seems to have been reduced this generation and that’s very much a welcome change, and that’s where the efficiency sees the largest delta to the A13.
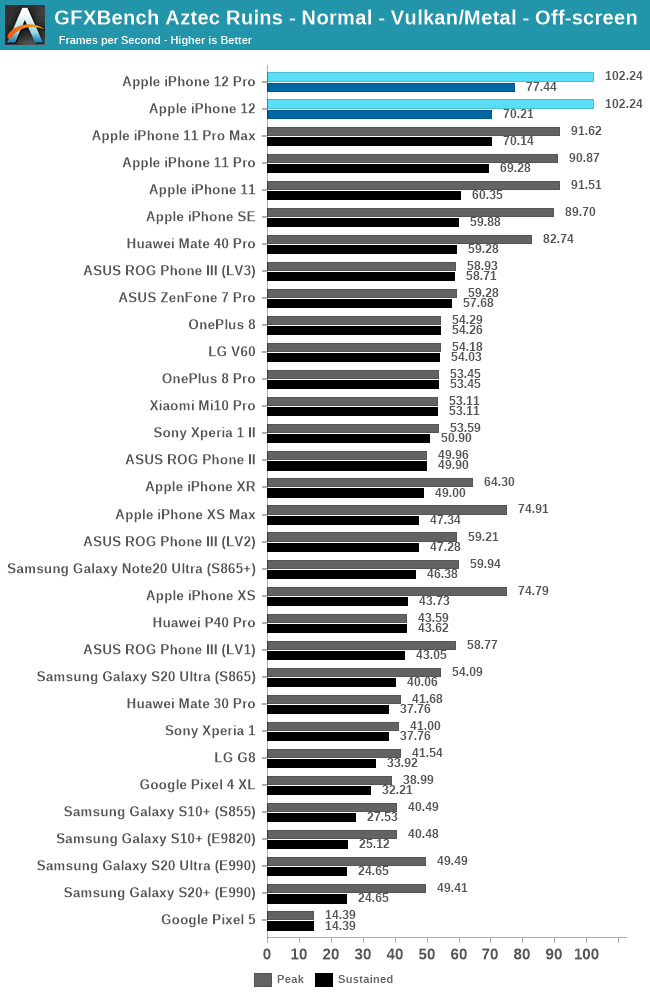
In the normal setting configuration of the Aztec test, we’re seeing again a 11% increase in sustained performance generationally, and a similar 12% boost in peak performance. These are good improvements but still a bit less than we had expected given the A14’s new process node and new GPU.
| GFXBench Aztec Normal Offscreen Power Efficiency (System Active Power) |
||||
| Mfc. Process | FPS | Avg. Power (W) |
Perf/W Efficiency |
|
| iPhone 12 Pro (A14) 🔥 Throttled | N5 | 77.44 | 3.88 | 19.95 fps/W |
| iPhone 12 Pro (A14) ❄️ Peak | N5 | 102.24 | 5.53 | 18.48 fps/W |
| iPhone 11 Pro (A13) 🔥 Throttled | N7P | 73.27 | 4.07 | 18.00 fps/W |
| iPhone 11 Pro (A13) ❄️ Peak | N7P | 91.62 | 6.08 | 15.06 fps/W |
| iPhone XS (A12) 🔥 Throttled | N7 | 55.70 | 3.88 | 14.35 fps/W |
| Galaxy S20 Ultra (Snapdragon 865) | N7P | 54.09 | 3.91 | 13.75 fps/W |
| iPhone XS (A12) ❄️Peak | N7 | 76.00 | 5.59 | 13.59 fps/W |
| Reno3 5G (Dimensity 1000L) | N7 | 27.84 | 2.12 | 13.13 fps/W |
| Mate 40 Pro (Kirin 9000) 🔥 Throttled | N5 | 63.56 | 5.37 | 11.84 fps/W |
| ROG Phone III (Snapdragon 865+) | N7P | 58.77 | 5.34 | 11.00 fps/W |
| Mate 40 Pro (Kirin 9000) ❄️ Peak | N5 | 82.74 | 7.95 | 10.40 fps/W |
| Mate 30 Pro (Kirin 990 4G) | N7 | 41.68 | 4.01 | 10.39 fps/W |
| Galaxy S20+ (Exynos 990) | 7LPP | 49.41 | 4.87 | 10.14 fps/W |
| Galaxy S10+ (Snapdragon 855) | N7 | 40.63 | 4.14 | 9.81 fps/W |
| Galaxy S10+ (Exynos 9820) | 8LPP | 40.18 | 4.62 | 8.69 fps/W |
The power figures showcase a similar generational movement, with a slight performance increase at a slight power decrease. It’s good progression but again not quite fulfilling our expectations of a new process node bump.
| GFXBench Manhattan 3.1 Offscreen Power Efficiency (System Active Power) |
||||
| Mfc. Process | FPS | Avg. Power (W) |
Perf/W Efficiency |
|
| iPhone 12 Pro (A14) 🔥 Throttled | N5 | 103.11 | 3.90 | 26.43 fps/W |
| iPhone 12 Pro (A14) ❄️ Peak | N5 | 137.72 | 5.63 | 24.46 fps/W |
| iPhone 11 Pro (A13) 🔥 Throttled | N7P | 100.58 | 4.21 | 23.89 fps/W |
| Galaxy S20 Ultra (Snapdragon 865) | N7P | 88.93 | 4.20 | 21.15 fps/W |
| iPhone 11 Pro (A13) ❄️Peak | N7P | 123.54 | 6.04 | 20.45 fps/W |
| iPhone XS (A12) 🔥 Throttled | N7 | 76.51 | 3.79 | 20.18 fps/W |
| Reno3 5G (Dimensity 1000L) | N7 | 55.48 | 2.98 | 18.61 fps/W |
| Mate 40 Pro (Kirin 9000) 🔥 Throttled | N5 | 87.31 | 4.98 | 17.54 fps/W |
| iPhone XS (A12) ❄️Peak | N7 | 103.83 | 5.98 | 17.36 fps/W |
| ROG Phone III (Snapdragon 865+) | N7P | 93.58 | 5.56 | 16.82 fps/W |
| Mate 40 Pro (Kirin 9000) ❄️Peak | N5 | 124.69 | 8.28 | 15.05 fps/W |
| Mate 30 Pro (Kirin 990 4G) | N7 | 75.69 | 5.04 | 15.01 fps/W |
| Galaxy S20+ (Exynos 990) | 7LPP | 85.66 | 5.90 | 14.51 fps/W |
| Galaxy S10+ (Snapdragon 855) | N7 | 70.67 | 4.88 | 14.46 fps/W |
| Galaxy S10+ (Exynos 9820) | 8LPP | 68.87 | 5.10 | 13.48 fps/W |
| Galaxy S9+ (Snapdragon 845) | 10LPP | 61.16 | 5.01 | 11.99 fps/W |
| Mate 20 Pro (Kirin 980) | N7 | 54.54 | 4.57 | 11.93 fps/W |
| Galaxy S9 (Exynos 9810) | 10LPP | 46.04 | 4.08 | 11.28 fps/W |
| Galaxy S8 (Snapdragon 835) | 10LPE | 38.90 | 3.79 | 10.26 fps/W |
| Galaxy S8 (Exynos 8895) | 10LPE | 42.49 | 7.35 | 5.78 fps/W |
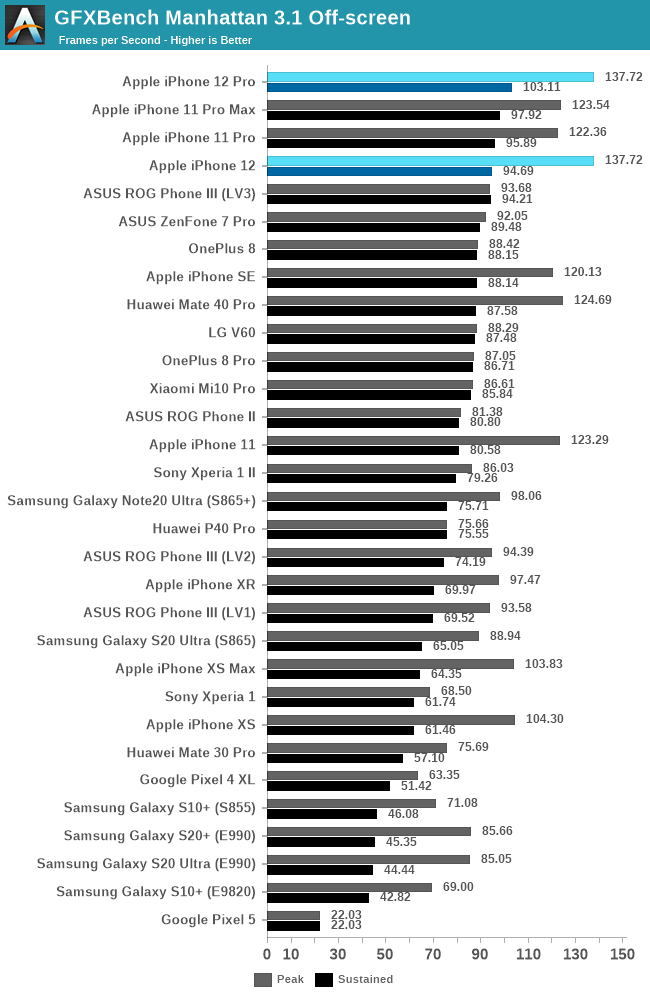
Depending on the workload, the generational performance increases can be even smaller, as here in Manhattan the performance increase in a throttled state is only 3% better for the new A14 based iPhone, with also a minor power decrease at this state.
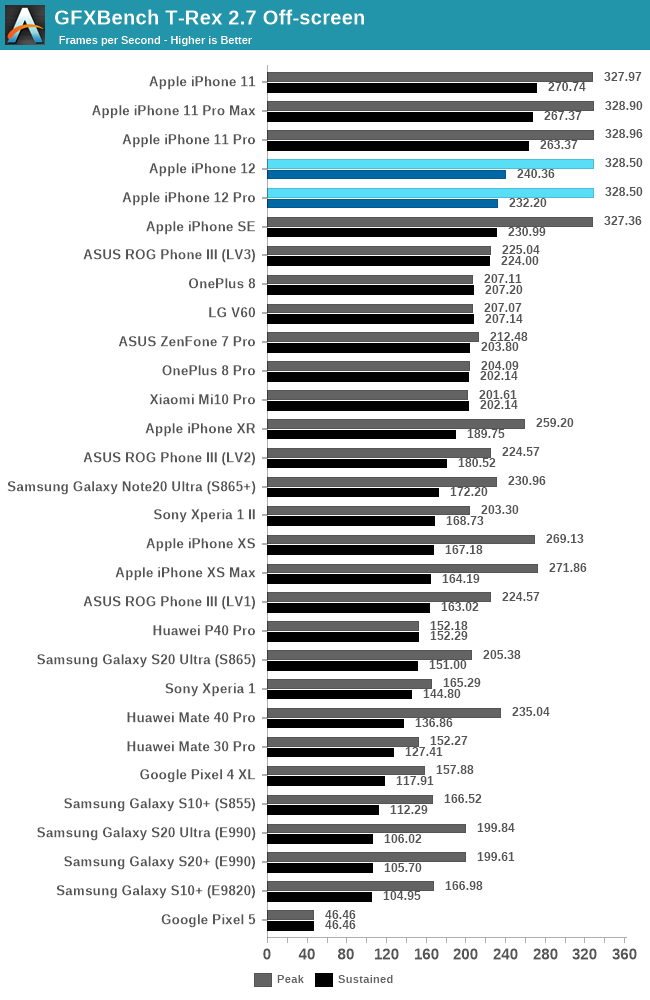
| GFXBench T-Rex Offscreen Power Efficiency (System Active Power) |
||||
| Mfc. Process | FPS | Avg. Power (W) |
Perf/W Efficiency |
|
| iPhone 12 Pro (A14) 🔥 Throttled | N5 | 260.28 | 4.08 | 63.97 fps/W |
| iPhone 11 Pro (A13) 🔥 Throttled | N7P | 289.03 | 4.78 | 60.46 fps/W |
| iPhone 12 Pro (A14) ❄️ Peak | N5 | 328.50 | 5.55 | 59.18 fps/W |
| iPhone 11 Pro (A13) ❄️ Peak | N7P | 328.90 | 5.93 | 55.46 fps/W |
| Galaxy S20 Ultra (Snapdragon 865) | N7P | 205.37 | 3.83 | 53.30 fps/W |
| Mate 40 Pro (Kirin 9000) 🔥 Throttled | N5 | 147.13 | 2.92 | 50.38 fps/W |
| iPhone XS (A12) 🔥 Throttled | N7 | 197.80 | 3.95 | 50.07 fps/W |
| ROG Phone III (Snapdragon 865+) | N7P | 224.48 | 4.92 | 45.60 fps/W |
| iPhone XS (A12) ❄️Peak | N7 | 271.86 | 6.10 | 44.56 fps/W |
| Galaxy 10+ (Snapdragon 855) | N7 | 167.16 | 4.10 | 40.70 fps/W |
| Reno3 5G (Dimensity 1000L) | N7 | 139.30 | 3.57 | 39.01 fps/W |
| Mate 40 Pro (Kirin 9000) ❄️ Peak | N5 | 235.04 | 6.11 | 38.46 fps/W |
| Galaxy S20+ (Exynos 990) | 7LPP | 199.61 | 5.63 | 35.45 fps/W |
| Mate 30 Pro (Kirin 990 4G) | N7 | 152.27 | 4.34 | 35.08 fps/W |
| Galaxy S9+ (Snapdragon 845) | 10LPP | 150.40 | 4.42 | 34.00 fps/W |
| Galaxy 10+ (Exynos 9820) | 8LPP | 166.00 | 4.96 | 33.40fps/W |
| Galaxy S9 (Exynos 9810) | 10LPP | 141.91 | 4.34 | 32.67 fps/W |
| Galaxy S8 (Snapdragon 835) | 10LPE | 108.20 | 3.45 | 31.31 fps/W |
| Mate 20 Pro (Kirin 980) | N7 | 135.75 | 4.64 | 29.25 fps/W |
| Galaxy S8 (Exynos 8895) | 10LPE | 121.00 | 5.86 | 20.65 fps/W |
Finally, T-Rex showcases no improvements on the part of peak performance figures, although it does lower power consumption, and sustained performance for some reason is lower on the newer generation iPhone, although again it showcases quite lower power consumption so it’s possible the new chip is mainly running on the efficiency CPU cores in this workload.
Reasonable Upgrades
Generally speaking, our concerns over Apple’s lacklustre marketing on the GPU side of things seem to have been warranted as the new A14 and the 5nm process node doesn’t seem to bring substantial gains this generation. Performance is a little higher, and efficiency has also gone up as well, but it’s nowhere near the levels of improvements that Apple had been able to achieve with the A12 and A13. On one side that’s pretty understandable as those two generations had made huge leaps, and on the other hand it was maybe unreasonable to expect Apple to continue to make such gigantic strides on every generation.
Overall, the new iPhone 12 devices and the A14 still offer the very best gaming performance of any smartphone out in the market, showcasing significantly better experiences than any other Android competitor, but it’s also not a major noticeable upgrade over the iPhone 11 series devices.


101 Comments
View All Comments
PickUrPoison - Saturday, December 12, 2020 - link
5s and 6 are like $25-50 used, they’re 5+ years old.TelstarTOS - Monday, November 30, 2020 - link
yet another skip year with notch.PickUrPoison - Saturday, December 12, 2020 - link
Get used to it. Apple’s ok with it. Eventually it’ll get smaller and occupy minimal bezel space. Think 7-10 years and be happy if it’s faster.anonomouse - Monday, November 30, 2020 - link
Is there a pending Mate 40 Pro / Kirin 9000 review where all of the numbers for that are coming from? The GPU in particular for that looks very.... not great.tk.icepick - Monday, November 30, 2020 - link
Great review Andrei!A small error: On the GPU Performance & Power page, the performance drop from 11 Pro to 12 Pro is 64.78 fps to 56.06 fps. The following paragraph lists a 45% performance regression, but that would be comparing the peak performance of 11 Pro to the sustained performance of 12 Pro.
56.06/64.78 = 86.53%. Still a regression, but only ~14%, not 45.
dudedud - Monday, November 30, 2020 - link
Speaking of the throttling, do the 12 series employ the same graphene layer to disperse the heat as last year iPhones?I haven't seen any indication of using it this time (iFixit didn't mention it), and maybe that's the reason for the lower sustained performance even when the efficiency is better?
flyingpants265 - Monday, November 30, 2020 - link
$799 is high, but it's more reasonable than $1300.Always remember that the Realme X 4GB is $145 USD on AliExpress, that should be the price for all budget phones going forward.
Amandtec - Tuesday, December 1, 2020 - link
Unless you work in an industry where China engages in industrial espionage. Then the extra $600 is easily worth it.flyingpants265 - Tuesday, December 1, 2020 - link
No, that doesn't matter at all. The point is that phones are cheap to make, and we should seek an option between $145-300 USD. Not an artificially gimped or overpriced option, or "midrange plus" Samsung phones sold to clueless consumers for $600 or more with inferior specifications. $300 is a good price for a Nexus 5 type phone.FunBunny2 - Tuesday, December 1, 2020 - link
"The point is that phones are cheap to make"depends on why that is.
1 - they're still made with a high level of labor input (not so much automation), both the final assembly that most consider 'making the phone' and the same for all the constituent parts all the way down the BoM
2 - they're made with a high level of automation (not so much labor), ditto the rest
in the 1) case, all producers from final assembly down the BoM, can maintain minimum average cost for most levels of output simply by expanding or contracting the labor force, and thus preserve profit
in the 2) case, there's less flexibility to maintain minimum average cost at any level of output, since all that automation has to be paid for no matter the level of output. in fact, the only way to maximize profit is to run that automation 24/7/365, thus spreading capital cost as thinly as possible over maximum output. moving production to still more 'business friendly, labor antagonistic' jurisdictions means there's less and less money to be had by exploiting labor; just not enough in the BoM to exploit.
so, if the BoM for smartphones is closer to 2), it's in the companies interest to maximize output level at all times, thus increasing supply, thus competition for consumers, and thus a lowering of actual sale price.
perhaps one of the AT mavens could look into this?