ASRock Industrial NUC BOX-1260P and 4X4 BOX-5800U Review: Alder Lake-P and Cezanne UCFF Faceoff
by Ganesh T S on August 5, 2022 8:15 AM EST- Posted in
- Systems
- AMD
- Intel
- UCFF
- Mini-PC
- ASRock Industrial
- Cezanne
- Alder Lake-P
System Performance: UL and BAPCo Benchmarks
Our 2022 test suite for Windows 11-based systems carries over some of the standard benchmarks we have been using over the last several years, including UL's PCMark and BAPCo's SYSmark. Starting this year, we are also including BAPCo's CrossMark multi-platform benchmarking tool.
PCMark 10
UL's PCMark 10 evaluates computing systems for various usage scenarios (generic / essential tasks such as web browsing and starting up applications, productivity tasks such as editing spreadsheets and documents, gaming, and digital content creation). We benchmarked select PCs with the PCMark 10 Extended profile and recorded the scores for various scenarios. These scores are heavily influenced by the CPU and GPU in the system, though the RAM and storage device also play a part. The power plan was set to Balanced for all the PCs while processing the PCMark 10 benchmark.
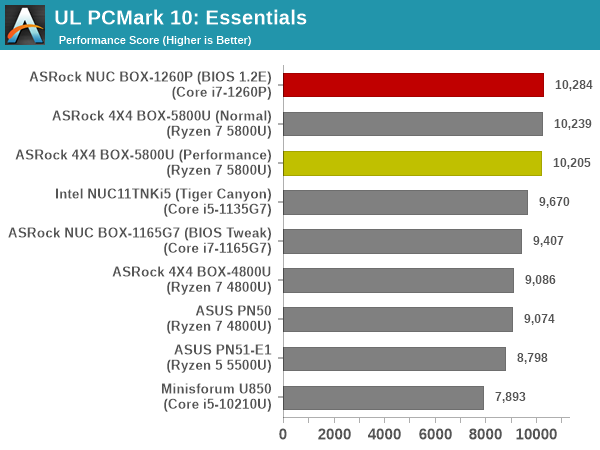
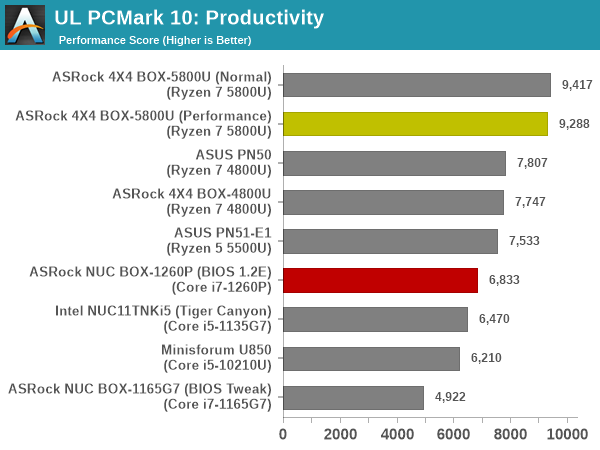
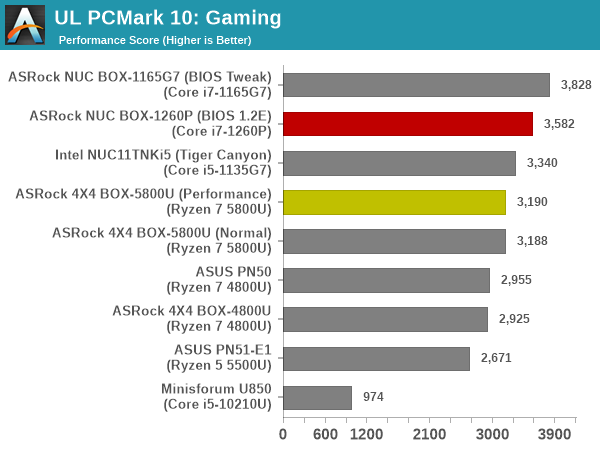
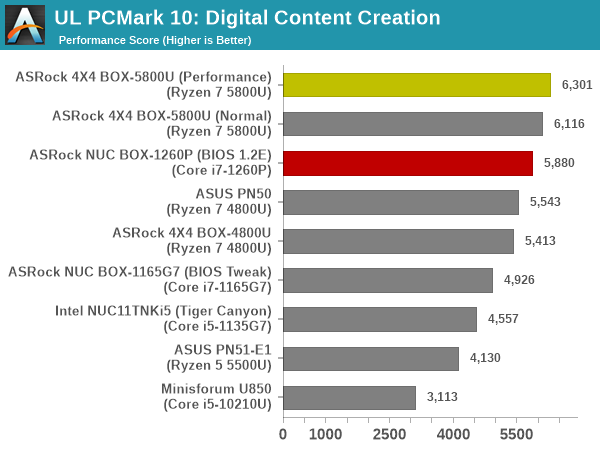
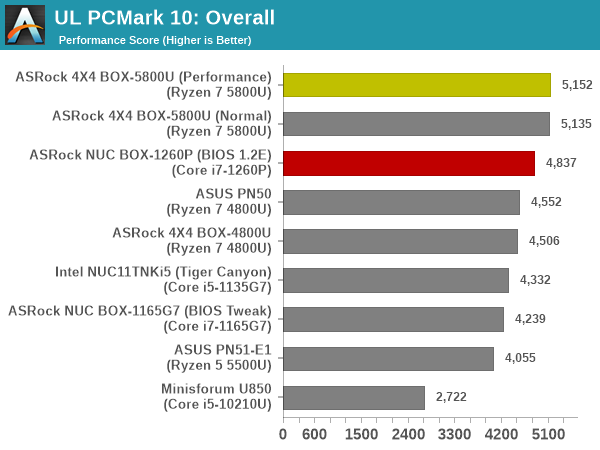
The Essentials and Gaming workloads see the NUC BOX-1260P come out on top with a narrow lead. However, the Productivity and Digital Content Creation workloads both heavily favor multi-threaded processors. The larger number of high-performance cores enable the 4X4 BOX-5800U to gain an healthy edge. Overall, we see the two Cezanne configurations occupy the top two spots in the PCMark 10 leaderboard.
BAPCo SYSmark 25
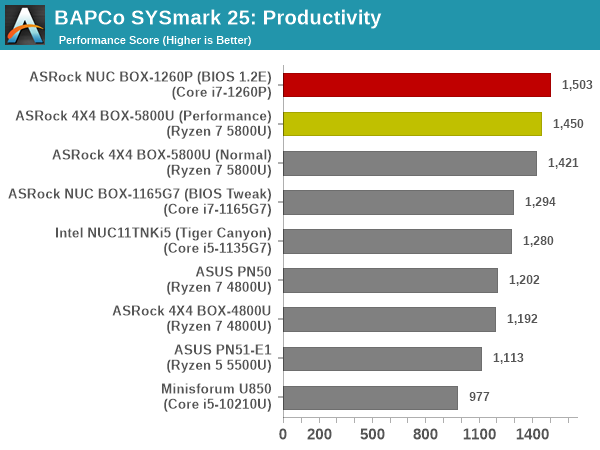
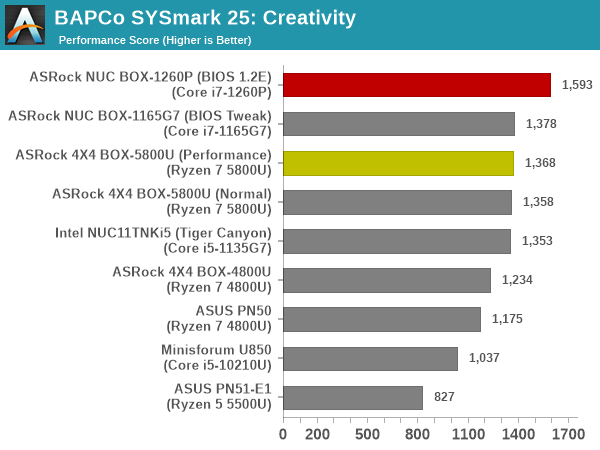
BAPCo's SYSmark 25 is an application-based benchmark that uses real-world applications to replay usage patterns of business users in the areas of productivity, creativity, and responsiveness. The 'Productivity Scenario' covers office-centric activities including word processing, spreadsheet usage, financial analysis, software development, application installation, file compression, and e-mail management. The 'Creativity Scenario' represents media-centric activities such as digital photo processing, AI and ML for face recognition in photos and videos for the purpose of content creation, etc. The 'Responsiveness Scenario' evaluates the ability of the system to react in a quick manner to user inputs in areas such as application and file launches, web browsing, and multi-tasking.
Scores are meant to be compared against a reference desktop (the SYSmark 25 calibration system, a Lenovo Thinkcenter M720q with a Core i5-8500T and 8GB of DDR4 memory to go with a 256GB M.2 NVMe SSD). The calibration system scores 1000 in each of the scenarios. A score of, say, 2000, would imply that the system under test is twice as fast as the reference system.


SYSmark 25 also adds energy measurement to the mix. A high score in the SYSmark benchmarks might be nice to have, but potential customers also need to determine the balance between power consumption and the performance of the system. For example, in the average office scenario, it might not be worth purchasing a noisy and power-hungry PC just because it ends up with a 2000 score in the SYSmark 25 benchmarks. In order to provide a balanced perspective, SYSmark 25 also allows vendors and decision makers to track the energy consumption during each workload. In the graphs below, we find the total energy consumed by the PC under test for a single iteration of each SYSmark 25 workload. For reference, the calibration system consumes 8.88 Wh for productivity, 10.81 Wh for creativity, and 19.69 Wh overall.
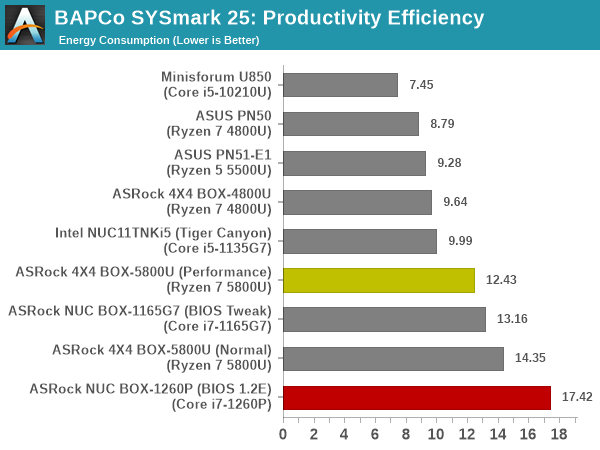
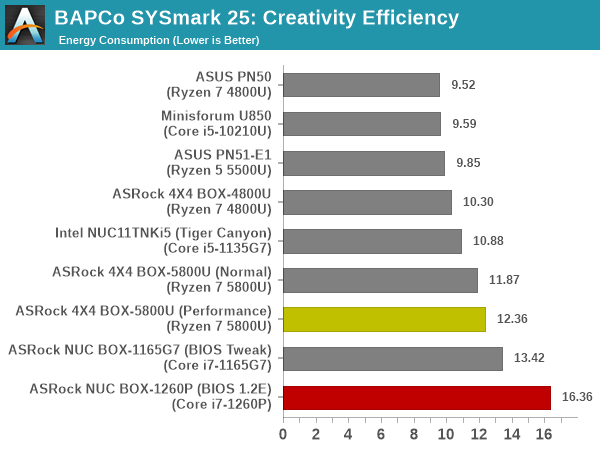
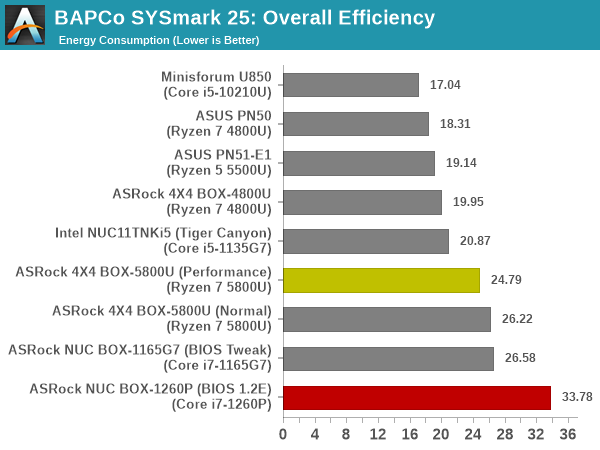
Though the NUC BOX-1260P gets high scores in all segments, the energy consumption is quite high. In fact, at 33.78 Wh overall, it is the worst performer by a significant margin (44.1 / Wh). On the other hand, the Cezanne system in performance mode delivers a score of 54.5 / Wh, and the normal mode delivers a score of 50.9 / Wh. The Cezanne system delivers better performance per Joule in SYSmark 25.
BAPCo CrossMark 1.0.1.86
BAPCo's CrossMark aims to simplify benchmark processing while still delivering scores that roughly tally with SYSmark. The main advantage is the cross-platform nature of the tool - allowing it to be run on smartphones and tablets as well.
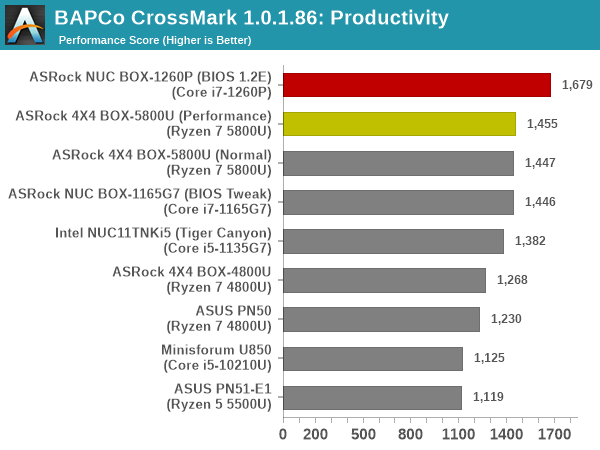
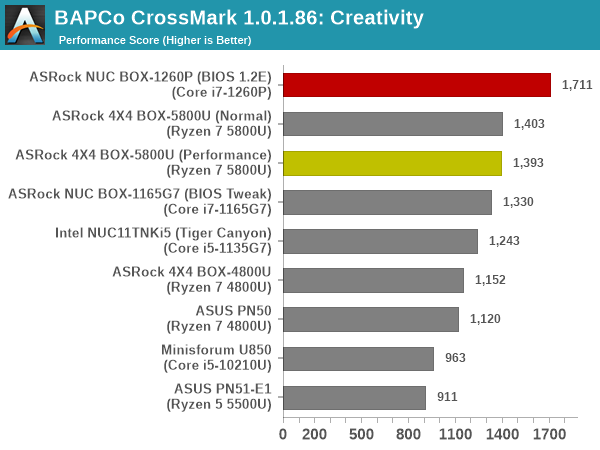
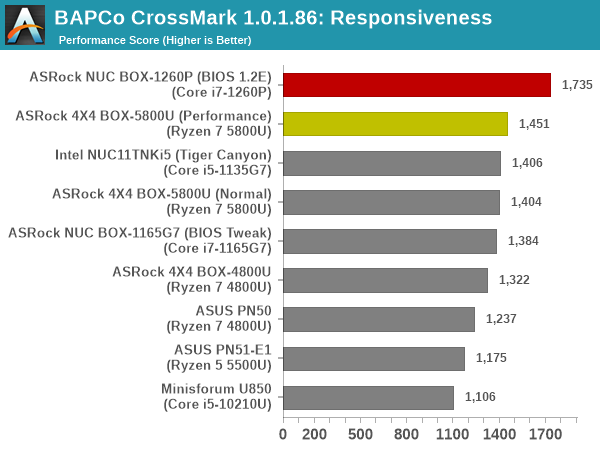
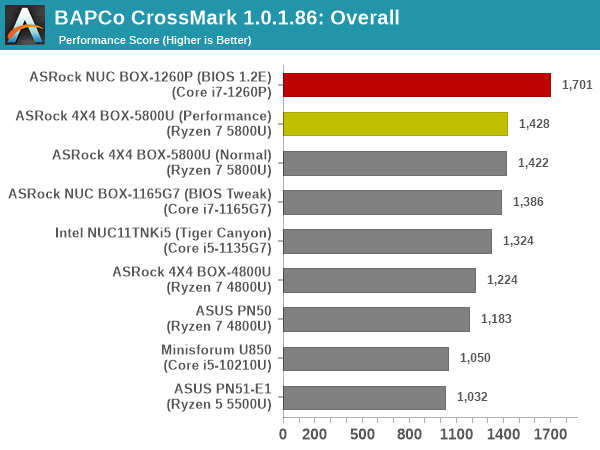
The relative performance seen in SYSmark 25 translate to CrossMark also, as expected. The NUC BOX-1260P comes out on top comfortably, and the Cezanne system is right behind.


34 Comments
View All Comments
erotomania - Saturday, August 20, 2022 - link
Very nice writing, Ganesh. I enjoyed reading the whole article, and I perhaps most enjoyed the section on storage. I would read more, just sayin'.Oxford Guy - Sunday, August 21, 2022 - link
'Due to the variation in configured power limits for both processors, it is not possible to do a scientific apples-to-apples comparison for each benchmark.'And the differences between the SSDs.
Oxford Guy - Sunday, August 21, 2022 - link
Perhaps I missed it. Where is the decibel-to-performance data, or even a simple noise under tough real-world workload chart?stan_dman - Wednesday, August 24, 2022 - link
Impressive little pc's. I'd be interested how noisy the cooling is. I had an optiplex 7050 with i5-7500t (tdp 35w) gave me a headache with a whiny fan.