Original Link: https://www.anandtech.com/show/2625
Intel Xeon 7460: Six Cores to Bulldoze Opteron
by Johan De Gelas on September 23, 2008 12:00 AM EST- Posted in
- IT Computing
The upcoming Intel Nehalem CPU has been in the spotlight for months now. In contrast and despite the huge die size and 1.9 billion (!) transistors, the 6-core Xeon 74xx is a wallflower for both the public as Intel's marketing. However, if you've invested in the current Intel platform, the newly launched Intel 74xx series deserves a lot more attention.
The Xeon 74xx, formerly known as Dunnington, is indeed a very interesting upgrade path for the older quad socket platform. All Xeon 74xx use the same mPGA604 socket as previous Xeons and are electrically compatible with the Xeon 73xx series. The Xeon 73xx , also known as Tigerton, was basically the quad-core version of the Xeon 53xx (Clovertown) that launched at the end 2006. The new hex-core Dunnington combines six of the latest 45nm Xeon Penryn cores on a single die. As you may remember from our dual socket 45nm Xeon 54xx review, the 45nm Penryn core is about 10% to 20% faster than its older 65nm brother (Merom). There is more: an enormous 12MB to 16MB L3 cache ensures that those six cores access high latency main memory a lot less. This huge L3 also reduces the amount of "cache syncing" traffic between the CPUs, an important bottleneck for the current Intel server platforms.
2.66GHz, 6 cores, 3x3MB L2, and 16MB L3 cache: a massive new Intel CPU
With at least 10% to 20% better performance per core, two extra cores per CPU package, and an upgrade that only requires a BIOS update, the newest Xeon 7460 should be an attractive proposal if you are short on processing power.
Six Cores?
Dunnington was announced at the past IDFs as "extending the MP leadership". Readers who read our last quad socket report understand that this is a questionable claim. Since AMD introduced the Opteron 8xxx in April 2003, there has never been a moment that Intel was able to lead the dance in the quad socket server market. Sure, the Intel 73xx was able to outperform the AMD chip in some areas (rendering), but the AMD quad-core was still able to keep up with Intel chip in Java, ERP, and database performance. When it comes to HPC, the AMD chip was clearly in the lead.
Dunnington might not be the darling of Intel marketing, but the chip itself is a very aggressive statement: let us "Bulldoze" AMD out of the quad socket market with a truly gigantic chip that only Intel can produce without losing money. Intel is probably - courtesy of the impressive ultra low leakage 45nm high-K process technology - the only one capable of producing large quantities of CPUs containing 1.9 billion transistors, resulting in an enormous die size of 503 mm2. That is almost twice the size of AMD's upcoming 45nm quad-core CPU Shanghai. Even IBM's flagship POWER6 processor (up to 4.7GHz) is only 341 mm2 and only has 790 million transistors.
| Processor Size and Technology Comparison | ||||
| CPU | transistors count (million) | Process | Die Size | Cores |
| Intel Dunnington | 1900 | 45 nm | 503 | 6 |
| Intel Nehalem | 731 | 45 nm | 265 | 4 |
| AMD Shanghai | 705 | 45 nm | 263 | 4 |
| AMD Barcelona | 463 | 65 nm | 283 | 4 |
| Intel Tigerton | 2 x 291 = 582 | 65 nm | 2 x 143 = 286 | 4 |
| Intel Harpertown | 2 x 410 = 820 | 45 nm | 2 x 107 = 214 | 4 |
The huge, somewhat irregular die - notice how the two cores in the top right corner are further away from the L3 cache than the other four - raises some questions. Such an irregular die could introduce extra wire delays, reducing the clock speed somewhat. Why did Intel not choose to go for an 8-core design? The basic explanation that Patrick Gelsinger, General Manager of Intel's Digital Enterprise Group, gave was that simulations showed that a 6-core with 16MB L3 outperformed 8-core with a smaller L3 in the applications that matter the most in the 4S/8S socket space.
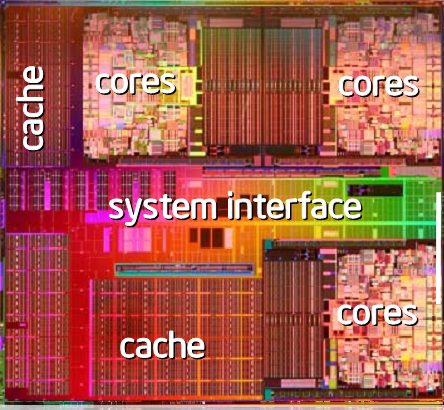
Layout of the new hex-core
TDP was probably the most important constraint that determined the choice of six cores, since core logic consumes a lot more power than cache. An 8-core design would make it necessary to reduce the clock speed too much. Even at 65nm, Intel was already capable of producing caches that needed less than 1W/MB, so we can assume that the 16MB cache consumes around 16W or less. That leaves more than 100W for the six cores, which allows decent clock speeds at very acceptable TDPs as you can see in the table below.
| Processor Speed and Cache Comparison | |||||
| Xeon model | Speed (GHz) | Cores | L2 Cache (MB) | L3 Cache (MB) | TDP (W) |
| X7460 | 2.66 | 6 | 3x3 | 16 | 130 |
| E7450 | 2.4 | 6 | 3x3 | 12 | 90 |
| X7350 | 2.93 | 4 | 2x4 | 0 | 130 |
| E7440 | 2.4 | 4 | 2x3 | 12 | 90 |
| E7340 | 2.4 | 4 | 2x4 | 0 | 80 |
| E7330 | 2.4 | 4 | 2x4 | 0 | 80 |
| E7430 | 2.13 | 4 | 2x3 | 12 | 90 |
| E7420 | 2.13 | 4 | 2x3 | 8 | 90 |
| L7455 | 2.13 | 6 | 3x3 | 12 | 65 |
| L7445 | 2.13 | 4 | 2x3 | 12 | 50 |
The other side of the coin is that Dunnington probably uses an L3 cache that runs at half the clock speed of the cores. We recorded a 103 cycle latency, measured with a 2.66GHz CPU (39 ns), for the L3 cache.
Dunnington cache hierarchy
In comparison, the - admittedly much smaller - L3 cache of the quad-core Opteron needs 48 cycles (using a 2.5GHz chip, or 19 ns). The L3 cache is about half as fast as the one found in the Barcelona core, so the L3 is a compromise where the engineers traded in speed for size and power consumption.
Price Comparisons
Clearly, six cores and 16MB of L3 cache does not come cheap:
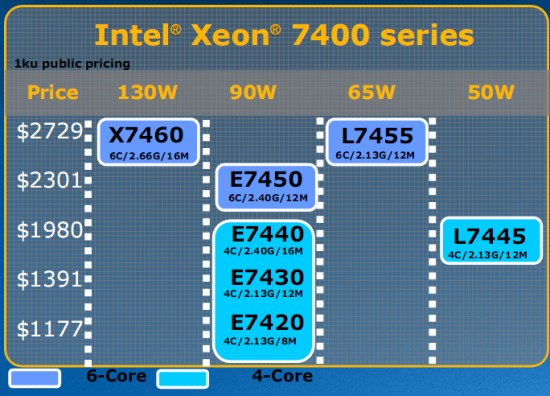
Pricing and TDP of the Xeon 74xx series
Let us see how this compares with the current AMD pricing, which AMD has not updated since March 2008.
| Server CPU Pricing | |||
| Intel CPU | Price | AMD CPU | Price |
| Xeon X7460 2.66GHz (6 core, 16MB) | $2729 | ||
| Xeon E7450 2.4GHz (6 Core, 12MB) | $2301 | Opteron 8360 SE 2.5GHz | $2149 |
| Xeon E7440 2.4GHz (12MB) | $1980 | Opteron 8358 SE 2.4GHz | $1865 |
| Xeon E7430 2.13GHz (12MB) | $1391 | Opteron 8356 2.3GHz | $1514 |
| Xeon E7420 2.13GHz (8MB) | $1177 | Opteron 8354 2.2GHz | $1165 |
| Opteron 8350 2.0GHz | $873 | ||
| Xeon L7455 2.13GHz (6 core, 12MB) | $2729 | ||
| Xeon L7445 2.13GHz (12MB) | $1980 | Opteron 8347 HE 1.9GHz | $873 |
If we use the numbers from our quad socket comparison, it is clear that the two top models of the newest Xeons are out of reach of AMD. You might remember that a 2.5GHz Opteron 8360 performs more or less at the level of a 2.93GHz Xeon X7350. The E7450 that replaces the X7350 has six improved cores and a massive 12MB L3, which should ensure the newest Xeon easily outperforms the X7350 despite having a clock speed disadvantage of about 20%. Intel remains stubborn when it comes to the lower power CPUs, which come with a huge price premium. This leaves a small opening for AMD with its upcoming 45nm Shanghai CPUs.
Benchmark configuration
Here are the specifications for the different test systems. All servers have been flashed to the latest BIOS, and unless we state otherwise the BIOS was set to default settings.
Xeon Server: Supermicro SC818TQ-1000 1U Chassis
2x-4x Intel Xeon E7330 at 2.4GHz
Supermicro X7QCE
16GB (8x2GB) ATP Registered FB-DIMM DDR2-667 CL5 ECC
NIC: Dual Intel PRO/1000 Server NIC
PSU: Supermicro 1000W w/PFC (Model PWS-1K01-1R)
Opteron Server: Supermicro SC828TQ-R1200LPB 2U Chassis
2x-4x AMD Opteron 8356 series at 2.3GHz
Supermicro H8QMi-2+
16GB (8x2GB) ATP Registered DIMM DDR2-667 CL5 ECC
NIC: Dual Intel PRO/1000 Server NIC
PSU: Supermicro 1200W w/PFC (Model PWS-1K22-1R)
Client Configuration: Intel Core 2 Quad Q6600
Foxconn P35AX-S
4GB (2x2GB) Kingston 667MHz DDR2
NIC: Intel Pro/1000
24 Cores in Action
So how do you test 24 cores? This is not at all a trivial question! Many applications are not capable of using more than eight threads, and quite a few are limited to 16 cores. Just look at what happens if you try to render with Cinema4D on this 24-headed monster: (Click on the image for a clearer view.)
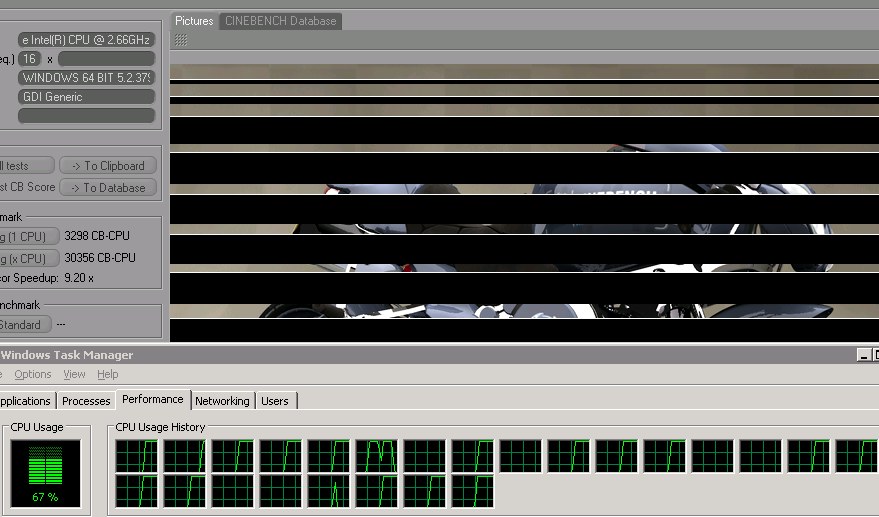 |
Cinebench fails to use all 24 cores
Yes, only 2/3 of the available processing power is effectively used. If you look closely, you'll see that only 16 cores are working at 100%.
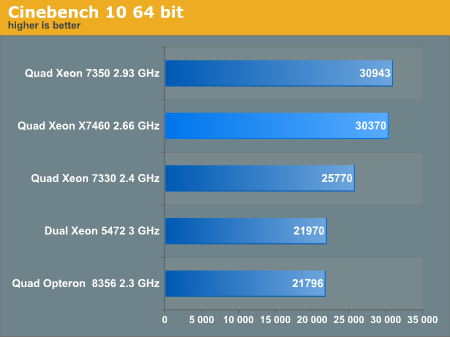
Cinebench is more than happy with the 3MB L2 cache, so adding a 16MB L3 has no effect whatsoever. The result is that only the improved Penryn core can improve the performance of the X7460. The sixteen 45nm Penryn cores at 2.66GHz are able to keep up with the sixteen 65nm Merom cores at 2.93GHz, but of course that is not good enough to warrant an upgrade. 3ds Max 2008 was no different, and in fact it was even worse:
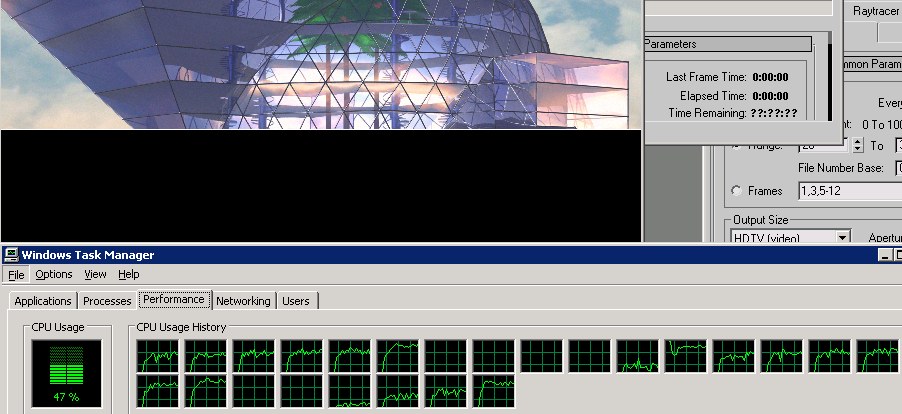 |
3dsMax 2008 seems to be limited to 16 cores too
As we had done a lot of benchmarking with 3ds Max 2008, we wanted to see the new Xeon 7460 could do. The scanline renderer is the fastest for our ray-traced images, but it was not able to fully use 16 cores. Like Cinebench, it completely "forgot" to use the eight extra cores that our Xeon 7460 server offers. The results are very low, around 62 frames per hour, while a quad Xeon X7350 can do 88. As we have no explanation for this weird behavior, we didn't graph the results. We will have to take some time to investigate this further.
Even if we could get the rendering engines to work on 24 cores or more, it is clear that there are better ways to get good rendering performance. In most cases, it is much more efficient to simply buy less expensive servers and use Backburner to render several different images on separate servers simultaneously.
Intel's Own Benchmarking
These machines are indeed suited for other kind of tasks. We are talking about a heavy backend server, commonly used for huge databases and two/three tier ERP applications. Intel's own benchmarking results reflect this.
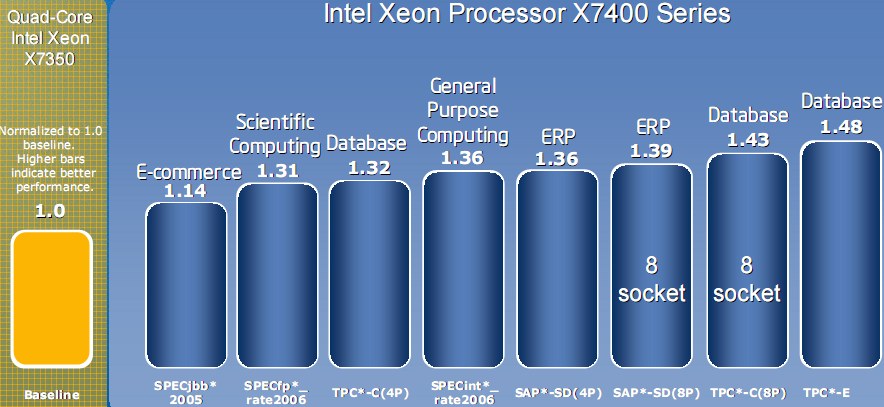 |
Benchmarks by Intel or other third parties
Intel compares the four- or eight-way X7460 (six cores at 2.66GHz) to the previous generation X7350 (four cores at 2.93GHz). Two results are particularly interesting. Let us start with the worst result: SPECjbb still seems to be limited by bandwidth despite the massive 16MB L3. The SAP results are interesting as the Xeon X7460 scales quite better than its predecessor. Notice how the eight socket results show a larger gap with the eight socket X7350 than when Intel compared a four socket X7460 and a four socket X7350. How does all this compare to AMD?
Third Party Benchmarking
Almost all the large players in the server market have adopted the Xeon 74xx. Below you can see an overview of the available systems. The systems on top have four sockets, while the systems in the lower half have eight to 16 sockets.
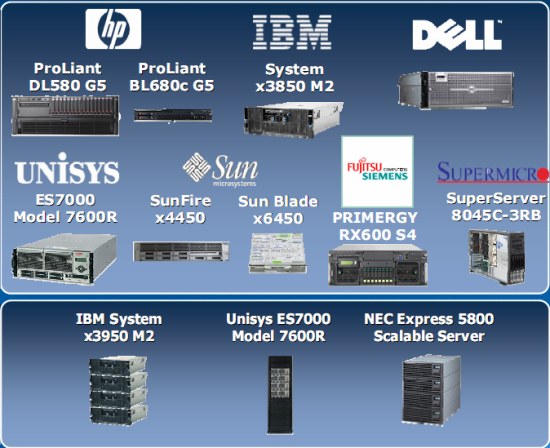
Servers available with the Xeon 74xx
Now let's see how these servers perform. Take a look at the TPC benchmarks that IBM and HP published. We'll compare them with the best score available for quad-core AMD Opteron.
- 635k TpmC ($1.10/TpmC) HP ProLiant DL580G5 (4x 2.66GHz Xeon X7460, 256GB, MSQL 2005, Win 2003)
- 1201k TpmC ($1.99/TpmC) IBM System x3950 M2 (8x 2.66GHz Xeon X7460, 512MB, DB2, RHEL 5)
- 472k TpmC (1.17/TpmC) HP DL585 (4x Opteron 8360 2.5GHz, 256GB, MSQL 2005, Win 2003)
The current Opterons do not scale very well from four to eight sockets and do not reach the higher clock speeds they need. The Xeon X7460 is a clear winner here: HP delivers a server with a very high price/performance ratio while IBM produces an expensive server platform that scales so well that it is out of reach of AMD. IBM delivers incredible high numbers thanks to its proprietary x3950 chipset server family. If money is not an issue, the x3950 is simply unbeatable in x86 land. The irony is that the x3950M2 is even a serious threat to the RISC market where IBM is so strong. Let's check out the ERP numbers.
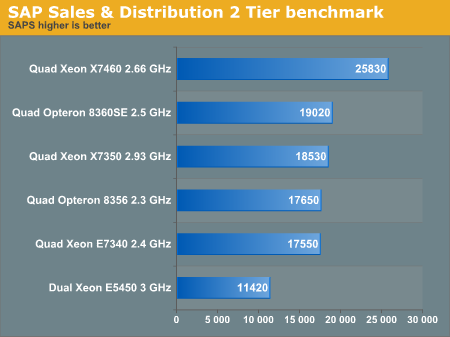
SAP SD
The SAP SD (Sales and Distribution, 2-tier internet configuration) benchmark is an extremely interesting benchmark as it is a real world client-server application. We decided to look at SAP's benchmark database. The results below are 2-tier benchmarks, so the database and the underlying OS can make a big difference. Unless we keep those parameters the same, we cannot compare the results. The results below all run on a Windows 2003 Enterprise Edition and MS SQL Server 2005 database (both 64-bit), and each "2-tier Sales & Distribution" benchmark was performed on SAP's "ERP release 2005".
In our previous server-oriented article, we summed up a rough profile of SAP S&D:
- Very parallel resulting in excellent scaling
- Low to medium IPC, mostly due to "branchy" code
- Not really limited by memory bandwidth
- Likes large caches
- Sensitive to Sync ("cache coherency") latency
AMD has held the performance crown in SAP S&D since the launch of the 8360SE at 2.5GHz, but the Intel six-core monster overpowers the latest quad-core Opteron. The huge cache, less cache coherency traffic between the sockets, and two extra cores make the new Xeon close to invincible. Even AMD's 45nm Opteron (Shanghai) will most likely not be able to outperform the Intel behemoth: the increase in L3 cache and small IPC improvements will probably not be able to negate the effect of two extra cores for Dunnington.
Until AMD starts shipping its 6-core products at the end of 2009, Intel will have a firm grip on the ERP and high-end database market. The SAP benchmark confirms that for this type of workload, the Xeon 74xx platform is close to unbeatable. However, we need to look at more than the high-end database market. What about virtualization?
Our First Virtualization Benchmark: OLTP Linux on ESX 3.5 Update 2
We are excited to show you our first virtualization test performed on ESX 3.5 Update 2. This benchmarking scenario was conceived as a "not too complex" way to test hypervisor efficiency; a more complex real world test will follow later. The reason we want to make the hypervisor work hard is that this allows us to understand how much current server CPUs help the hypervisor, keeping the performance overhead of virtualization to a minimum. We chose to set up a somewhat unrealistic (at this point in time) but very hypervisor intensive scenario.
We set up between two and six virtual machines running an OLTP SysBench 0.4.8 test on MySQL 5.1.23 (INNODB Engine). Each VM runs as a guest OS on a 64-bit version of Novell's SLES 10 SP2 (SUSE Linux Enterprise Server). The advantage of using a 64-bit operating system on top of ESX 3.5 (Update 2) is that the ESX hypervisor will automatically use hardware virtualization instead of binary translation. Each virtual machine gets its own four virtual CPUs and 2GB of RAM.
To avoid I/O dominating the entire benchmark effort, each server is connected to our Promise J300S DAS via a 12Gbit/s Infiniband connection. The VMs are installed on the server disks but the databases are placed on the Promise J300S, which consists of a RAID 0 set of six 15000RPM Seagate SAS 300GB disks (one of the fastest hard disks you can get). A separate disk inside the Promise chassis is dedicated to the transactional logs; this reduces the disk "wait states" from 8% to less than 1%. Each VM gets its own private LUN.
Each server is equipped with an Adaptec RAID 5085 card. The advantage is that this card is equipped with a dual-core Intel IOP 348 1.2GHz and 512MB of DDR2, which helps us ensure the RAID controller won't be a bottleneck either.
Our first virtualized benchmark scenario; the green part is the server and the yellow part is our Promise DAS enclosure.
We use Logical Volume Management (LVM). LVM makes sure that the LUNs are aligned and start at a 64KB boundary. The file system on each LUN is ext3, with the -E stride=16 option. This stride is necessary as our RAID strip size is 64KB and Linux (standard) only allows a block size of 4KB.
The MySQL version is 5.1.23 and the MySQL database is configured as follows:
max_connections=900
table_cache=1520
tmp_table_size=59M
thread_cache_size=38
#*** INNODB Specific options ***
innodb_flush_log_at_trx_commit=1
innodb_log_buffer_size=10M
innodb_buffer_pool_size=950M
innodb_log_file_size=190M
innodb_thread_concurrency=10
innodb_additional_mem_pool_size=20M
Notice that we set flush_log_at_trx_commit = 1, thanks to the Battery Backup Unit on our RAID controller; our database offers full ACID behavior as appropriate for an OLTP database. We could have made the buffer pool size larger, but we also want to be able to use this benchmark scenario in VMs with less than 2GB memory. Our 1 million record database is about 258MB and indices and rows fit entirely in memory. The reason we use this approach is that we are trying to perform a CPU benchmark; also, many databases now run from memory since it is pretty cheap and abundant in current servers. Even 64GB configurations are no longer an exception.
Since we test with four CPUs per VM, an old MySQL problem reared its ugly head again. We found out that CPU usage was rather low (60-70%). The reason is a combination of the futex problems we discovered in the old versions of MySQL and the I/O scheduling of the small but very frequent log writes, which are written immediately to disk. After several weeks of testing, we discovered that using the "deadline" scheduler instead of the default CFQ (Complete Fair Queuing) I/O scheduler solved most of our CPU usage problems.
Each 64-bit SLES installation is a minimal installation without GUI (and runlevel = 3), but with gcc installed. We update the kernel to version 2.6.16.60-0.23. SysBench is compiled from source, version 0.4.8. Our local Linux gurus Philip Dubois and Tijl Deneut have scripted the benchmarking of SysBench. A master script on a Linux workstation ensures SysBench runs locally (to avoid the time drift of the virtualized servers) and makes SQL connections to each specified server while running all tests simultaneously. Each SysBench database contains 1 million records, and we start 8 to 32 threads, in steps of 8. Each test performs 50K transactions.
ESX 3.5 Update 2 Virtualization Results
Disclaimer: Do not try to interpret these results if you are in a hurry!
We apologize for this warning to our astute readers, for whom it will be obvious that you cannot simply take the following graphs at face value. Unfortunately, many people tend to skip the text and just look at the pictures, which could lead to many misinterpretations. We want to make it clear that when you combine three different software layers - Hypervisor, OS or "Supervisor", and Server Application - on top of different hardware, things get very complex.
In our very first virtualization benchmark, we give each VM four virtual CPUs. With two and four VMs, we do not "oversubscribe", i.e. each virtual CPUs corresponds at least one physical CPU. In the case of six VMs, we oversubscribe some of the servers: the Xeon 73xx (Tigerton) and Opteron (Barcelona) platforms only have 16 physical CPUs, and we allocate 24. Oversubscribing is a normal practice in the virtualization world: you try to cut your costs by putting as many servers as is practical on one physical server. It's rare that all your servers are running at 100% load simultaneously, so you allow one VM to use some of the CPU power that another VM is not currently using. That is the beauty of virtualization consolidation after all: making the best use of the resources available.
The virtual CPUs are not locked to physical cores; we let the hypervisor decide which virtual CPU corresponds to which physical CPU. There is one exception: we enable NUMA support for the Opteron of course. For now, we limit ourselves to six VMs as several non-CPU related (probably storage) bottlenecks kick in as we go higher. We are looking at how we can test with more VMs, but this will require additional research.
This limit is a perfect example for understanding how complex virtualization testing can get. We could disable flushing the logs immediately after commit, as this would reduce the stress on our disk system,and make it a more CPU limited benchmark even with more than six VMs. However, this would mean that our test loses ACID compliance, which is important for an OLTP test. In a native test, this may be acceptable if you are just looking to test the CPU performance; it's probably just a matter of adding a few more spindles. However, this kind of reasoning is wrong when you work with virtualized servers. By disabling the immediate flushing of logs, you are lowering the impact on the hypervisor in several ways. Your hypervisor has to do less work, hence the impact on the CPU is lowered, and the objective of this test is to see how well a CPU copes with a virtualized environment.
Consolidation courtesy of virtualization is a compromise between performance per VM and total throughput of the physical machine. You want to put as many virtual servers as possible on one physical server to maximize throughput and cost reduction, but you do not want to see individual VM performance decrease below a certain threshold. If you sacrifice too much individual virtual server performance in order to get more VMs on one server, your CFO will be happy but your users will complain. It is therefore important to look at both the performance per virtual server and total throughput of the physical machine. The first graph shows you the number of transactions per Virtual Server. For those interested, this is an average and individual virtual servers show +/-5% compared to this average.
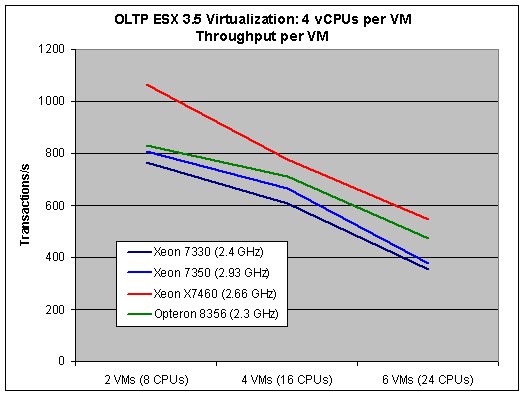
As expected, the highest result per virtual server is achieved if we only run two VMs. That is normal, since it means that the physical server has eight CPUs left to handle the console and hypervisor overhead. Nevertheless, those two factors cannot explain why our results fall so much once we activate four VMs and all 16 CPUs cores are busy.
| Performance loss from 2 VMs to 4 VMs | |
| Xeon 7330 (2.4GHz) | -21% |
| Xeon 7350 (2.93GHz) | -17% |
| Xeon X7460 (2.66GHz) | -27% |
| Opteron 8356 (2.3GHz) | -15% |
Our internal tests show that you should expect the Hypervisor to require about 12% of the CPU power per VM and the impact of the console should be minimal. In the first test (two VMs) there is more than enough CPU power available as we use only half (Opteron 8356, Xeon 73xx servers) to one third (X7460 server) of what is available. The real performance losses however are in the range of 15% (Opteron) to 27% (Xeon X7460). So where is the other bottleneck?
The database is 258MB per VM, and therefore runs almost completely in our INNODB buffer pool. We suspect the extra performance comes from the extra bandwidth that two extra VMs demand. Notice how the Opteron - the server with the highest bandwidth - has the lowest loss. That gives us our first hint, as we know that more VMs also result in higher bandwidth demands. Secondly, we see that the Xeon X7350 loses a little less than the E7330 (percentagewise) when you fire up two extra VMs. The slightly bigger cache on the X7350 (2x4MB) reduces the pressure on the memory a bit.
Next, we compare the architectures. To do this, we standardize the Xeon E7330 (2.4GHz) result to 100%.
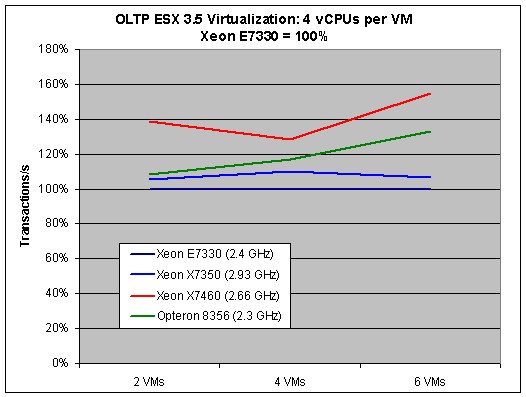
This graph is worth a very close investigation, since we can study the impact of the CPU core architecture. As we are using only eight CPUs and 4GB if we run two VMs, the Xeon 7460 cannot leverage its most visible advantage: the two extra cores. With two VMs, performance is mostly determined - in order of importance - by:
- (Futex) Thread synchronization (we have up to 32 threads working on the database per VM)
- Raw integer crunching power
- VM to Hypervisor switching time (to a lesser degree)
The X7460 is based on the Penryn architecture. This 45nm Intel core features slightly improved integer performance but also significantly improved "VM to Hypervisor" switching time. On top of that, synchronization between CPUs is a lot faster in the X74xx series thanks to the large inclusive L3 cache that acts as filter. Memory latency is probably great too, as the VMs are probably running entirely in the L2 and L3 caches. That is the most likely reason why we see the X7460 outperform all other CPUs.
Once we add two more VMs, we add 4GB and eight CPUs that the hypervisor has to manage. Memory management and latency become more important, and the Opteron advantages come into play: the huge TLB ensures that TLB misses happen a lot less. The TLB is also tagged, making sure "VM to Hypervisor" switching does not cause any unnecessary TLB flushes. As we pointed out before, the complex TLB of the Barcelona core - once the cause of a PR nightmare - now returns to make the server platform shine. We measured that NPT makes about a 7-8% difference here. That might not seem impressive at first sight, but a single feature capable of boosting the performance by such a large percentage is rare. The result is that the Opteron starts to catch up with the Xeon 74xx and outperforms the older 65nm Xeons.
The impact of memory management only gets worse as we add two more VMs. The advantages described above allow the Opteron to really pull away from the old Xeon 73xx generation. However, in this case the Xeon X7460 can leverage its eight remaining cores, while the Opteron and older Xeon servers do not have that luxury. The hypervisor has to juggle six VMs that are demanding 24 cores, while there are only 16 cores available on the Opteron and Xeon 73xx servers. That is why in this case the Xeon X7460 is again the winner here: it can consolidate more servers at a given performance point than the rest of the pack.
To appreciate what the 6-core Xeon is doing, we need to look at the total throughput.
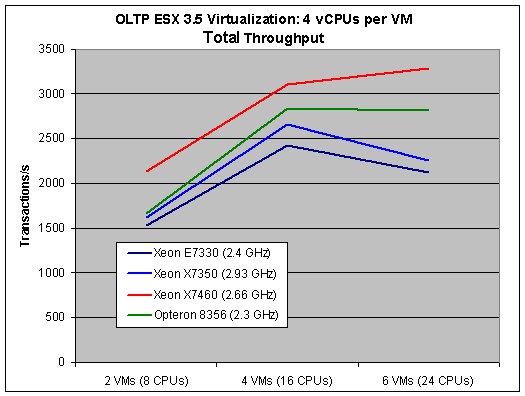
Notice how the Opteron is able to keep performance more or less stable once you demand 24 virtual CPUs, while the performance of Xeon 73xx takes a nosedive. The winner is of course the Intel hex-core, which can offer 24 real cores to the hypervisor. The Dunnington machine is capable of performing almost 3300 transactions per second, or no less than 45% more than its older brother that is clocked 11% higher. The Opteron does remarkably well with more than 2800 transactions per second, or about 24% better than the Xeon that has twice the cache and a 27% better clock speed (X7350 at 2.93GHz).
Power
The Opteron may have a slight disadvantage here as it has a 1200W PSU instead of a 1000W unit. We had no choice as our 1U server with 1000W PSU that we used in our previous reviews is not supported by ESX. Our Supermicro SC828TQ-R1200LPB 2U works very well with ESX, but it may consume a few extra Watts. (Or perhaps not - without testing both PSUs we really don't know their efficiency curves.) All Xeons use the exact same chassis, motherboard and power supply. We decided to test with both 16GB and 32GB. In our benchmarking scenario we only needed 16GB, as our VMs were very processing intensive and didn't need more memory. In the real world, it is much more likely that most of your VMs need far less processing power and will require more memory (especially when you run more VMs). The extra data point allows you to understand how much power eight extra DIMMs require, allowing you to estimate how much power your setup will consume.
| System Power Comparison | |||
| Typical CPU load | Power with 6 VMs at full load (16GB) |
Power with 6 VMs at full load (32GB) |
|
| Xeon 7330 (2.4GHz) | 91-96% | 456 | 541 |
| Xeon 7350 (2.93GHz) | 90-95% | 605 | 692 |
| Xeon X7460 (2.66GHz) | 85-90% | 502 | 587 |
| Opteron 8356 (2.3GHz) | 95-99% | 485 | 534 |
It's amazing to see that the 6-core X7460 is capable of staying well below its older 65nm brother, the X7350 at 2.93GHz. Both CPUs have the same TDP, but the 6-core X7460 consumes 25W less per CPU than the X7350. Part of this can be explained by slightly lower CPU usage as the 24 cores do not have to work as hard to handle the six VMs. The X7460 is a huge chip, but that does not prevent the newest Xeon from performing 45% better while consuming 25W less per CPU.
| Transactions per Watt | |
| Xeon 7330 (2.4GHz) | 3.93 |
| Xeon 7350 (2.93GHz) | 3.26 |
| Xeon X7460 (2.66GHz) | 5.59 |
| Opteron 8356 (2.3GHz) | 5.26 |
This table also helps explain why it is so important for Intel not to wait for a Xeon Nehalem MP to regain the performance crown. The current Xeon 73xx MP line takes a serious beating from the Opteron when it comes to virtualized performance/Watt. However, this table also makes it clear that the current Opteron has no chance of beating the 45nm Xeon MP. If we use the 8360SE (2.5GHz) instead of the 8356, performance will rise 8% at the most, but power consumption will probably increase by 20-30%, resulting in an even worse performance/Watt result.
Limitations of this report
We are happy that we finally feel comfortable with most of our virtualization testing. We still have to do some in-depth profiling to be completely sure what is going on, but we decided to not wait any longer. This is only the beginning, though. We have tested several other virtualization scenarios (including Windows as Guest OS, Hyper-V as hypervisor, Oracle as database, and so on) but we are still checking the validity of those benchmarks. In other words, we are well aware that this report cannot give you a complete picture; it's only an initial rough draft.
Here are the limitations of our current virtualization testing:
- Out of all the databases, MySQL has shown the best performance on the AMD platform relative to the Intel platform. This is probably a result of the excellent Opteron and Athlon 64 optimizations in the gcc compiler.
- We use a 64-bit version of MySQL, and the Intel architectures pay a small penalty when you run a 64-bit database (no macro-op fusion for example). However, as the 64-bit MySQL performs quite a bit better than the 32-bit one, we feel we made the right decision.
- Our best Opteron is a 95W Opteron 8356, while we used a 130W Xeon X7460 and a 130W Xeon X7350. This is simply a result of what we have had available in the labs in the past months. This problem is easy to solve: the performance of the Opteron 8360SE (125W) will be between 1% and 8% higher, so for those looking at the Opteron 8360SE it is pretty easy to get an idea what this CPU could do.
- No HPC benchmarking, as we wanted to focus our efforts and time on our first virtualization results. Priorities…
Please keep these limitations in mind.
Conclusion
The third party benchmark numbers are unanimous: servers based on Intel's monster hex-core processor are the best choice when for high-end database/ERP applications. Compared to the previous Xeons, performance has increased by 40% or more while power consumption has dropped. The 6-core Xeon is the clear winner and offers a very nice upgrade path for owners of current Xeon 73xx servers. We even dare to predict that the newest Nehalem based Xeons will not really enter this market before the octal-core Beckton is launched in the second half of 2009.
When it comes to the virtualization market, which is a much larger market (in shipments), it is a very different picture. Where the 6-core CPU extends an existing lead elsewhere, for virtualization the new 45nm Xeon MP comes just in time. The quad-core Opteron has been giving the Xeon 73xx a serious beating, offering up to 24% better performance while using 20-25% less power (X7350 versus 8356). If you prefer to look at CPUs with approximates the same TDP, Opteron was offering about a third more performance while consuming a few Watts less. The hot and power hungry FB-DIMMs do not help in a market where performance/Watt and more memory (higher consolidation ratios) rule, and the Opteron clearly has better virtualization support.
The new 45nm Xeon X7460 brings the virtualized performance/Watt crown back to the Intel camp, and we expect the E7450 (2.4GHz) to offer an even better performance/Watt ratio. After all, the E7450 also has six cores but at a lower TDP. In the very near term, AMD will probably have no other choice than to lower the price of its fastest quad-cores. Nevertheless, the battle for the virtualization market is still not over, as both AMD and Intel have new quad-cores lined up.
Quite a few people gave us assistance with this project, and as always we would like to thank them. Our thanks goes to Sanjay Sharma, Trevor Lawless, Kristof Sehmke, Matty Bakkeren, Damon Muzny, Brent Kerby, Michael Kalodrich and Angela Rosario. A very special thanks to Kaushik Banerjee who pointed out errors in our virtualization benchmarking procedure and Tijl Deneut, who helped me solve the weirdest problems despite the numerous setbacks we encountered in this project.


