Original Link: https://www.anandtech.com/show/2964/the-intel-xeon-5670-six-improved-cores
The Intel Xeon 5670: Six Improved Cores
by Johan De Gelas on March 16, 2010 3:39 PM EST- Posted in
- IT Computing
The new Xeon “Westmere” 5600 series, has arrived. Basically an improved 32nm version of the impressive Xeon 5500 series “Nehalem” CPU. The new Xeon won’t make a big splash like the Xeon 5500 series did back in March 2009. But who cares? Each core in the Xeon 5600 is a bit faster than the already excellent performing older brother, and you get an extra bonus. You choose: in the same power envelope you get two extra cores or 5-10% higher clockspeed. Or if you keep the number of cores and clockspeed constant, you can get lower power consumption. The most thrifty quadcore Xeon is now specced at a 40W TDP instead of 60W.
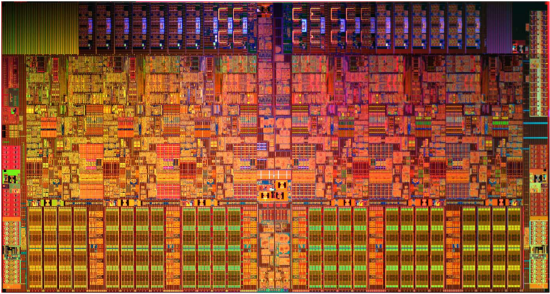
The Westmere Die: an enlarged Nehalem. Trivia: Notice the unused space on the top left
Intel promises up to 40% better performance or up to 30% lower power. The Xeon 5600 can use the same servers and motherboards at the Xeon 5500 after a BIOS update, making the latter almost redundant. Promising, but nothing beats some robust independent benchmarking to check the claims.
So we plugged the Westmere EP CPUs in our ASUS server and started to work on a new Server CPU comparison. Only one real problem: our two Xeon X5670 together are good for 12 cores and 24 simultaneous threads. Few applications can cope with that, so we shifted our focus even more towards virtualization. We added Hyper-V to our benchmark suite, hopefully an answer to the suggestion that we should concentrate on other virtualization platforms than VMware. For those of you looking for Opensource benchmarks, we will follow up with those in April.
Platform Improvements
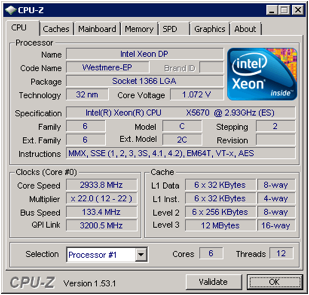
Westmere is more than just a die shrunk Nehalem. In this review we're taking a look at the Xeon X5670 2.93 GHz, the successor to the 2.93GHz Xeon X5570.
The most obvious improvement is that the X5670 comes with six instead of four cores, and a 12MB L3 cache instead of an 8MB cache. But there are quite a few more subtle tweaks under the hood:
- Virtualization : VMexit latency reductions
- Power management: An “uncore” power gate and support for low power DDR-3
- TLB improvements: Address Space IDs (ASID) and 1 GB pages
- Yet another addition to the already incredible crowded x86 ISA (AES_NI).
Just a few years ago, many ESX based servers used binary translation to virtualize their VMs. Binary translation used clever techniques to avoid transitions to the hypervisor. In the case of the Pentium 4 Xeons, using software instead of hardware virtualization was even a best practice. As we explained earlier in “Hardware virtualization: the nuts and bolts”, hardware virtualization can be faster than software virtualization so long as VM to hypervisor transitions happen quickly. The new Xeon 5600 Westmere does this about 12% faster than Nehalem.
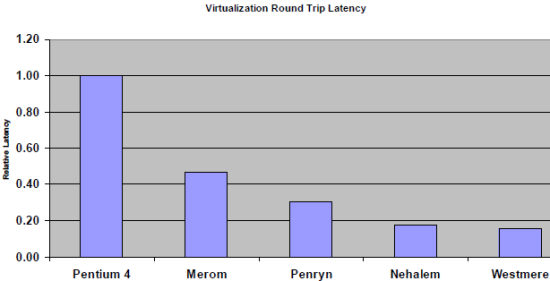
Pretty impressive, if you consider that this makes Westmere switch between hypervisor and VM twice as fast as the “Xeon 5400” series (based on the Penryn architecture), which itself was fast. As the share of the VM-hypervisor-VM in hypervisor overhead gets lower, we don’t expect to see huge gains though. Hypervisor overhead is probably already dominated by other factors such as emulating I/O operations.
The Xeon 3400 “Lynnfield” was the first to get an un-core power gate (primarily the L3 cache). An un-core power gate will reduce the leakage power to a minimum if the whole CPU is in a deep sleep state. In typical server conditions, we don’t think this will happen often. Shutting down the un-core means after all that all your cores (even those at the other CPU) should be sleeping too. If only one core is even the slightest bit active, the L3-cache and memory controller must be working. For your information, we discussed server power management, including power gating in detail here.
The fact that Westmere's memory controller supports low power DDR3 might have a much larger impact on the your server’s power consumption. In a server with 32GB or more memory, it is not uncommon for the RAM power consumption to be about quarter of the total server power consumption. Moving to 40nm low power DDR3 drops DRAM voltage from 1.5V to 1.35V, which can make a big impact on that quarter of server power.
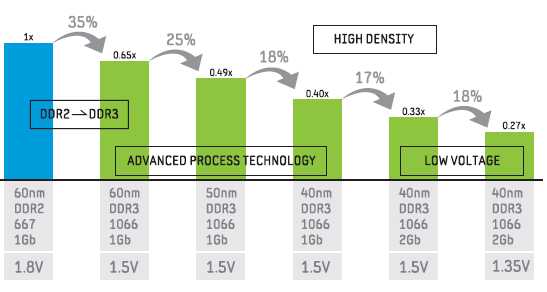
According to Samsung, 48 GB of 40nm low power DDR3 1066 should use on average about 28W (an average of 16 hour idle and 8 hours of load). This compares favorably with the 66W for the early 60nm DDR3 and the currently popular 50nm based DRAM which should consume about 50W. So in a typical server configuration, you could save – roughly estimated – 22W or about 10% of the total server power consumption.
AMD has more than once confirmed that they would not use DDR3 before low power DDR3 was available. So we expect this low power DDR3 to be quite popular.
There is more. The Xeon 5600 also supports more memory and higher clock speeds. You can now use up to two DIMMs at 1333MHz, while the Xeon 5500 would throttle back to 1066MHz if you did this. The Xeon 5500 was also limited to 12 x 16 GB or 192 GB. If you have very deep pockets, you can now cram 18 of those ultra expensive DIMMs in there, good for 288 GB of DDR3-1066!
Deeper buffers allow the memory controller of the Westmere to be more efficient: a dual Xeon 5670 reaches 43 GB/s while the older X5570 was stuck at 35 GB/s with DDR-3 1333. That will make the X5670 quite a bit faster than its older brother in bandwidth intensive HPC software.
Exotic improvements
With many VMs running on top of a hypervisor, flushing the TLB each time you switched to another VM or to the hypervisor was a costly operation. So the TLBs of the AMD Barcelona cores got a new VM specific tag, called the Address Space IDentifier (ASID). An ASID field was added to each TLB tag. Intel followed this example more than a year later with its Nehalem CPU. The ASIDs allow the TLB to keep track of which TLB entry belongs to which VM. The result is that a VM switch does not flush the TLB. There's more info on this here.
Since context switching does not only happen between CPUs but also between processes (each process has its own virtual address space), this feature might also be handy for a “native” OS. Some CPU families already incorporated ASIDs a long time ago. Guess. Of course, the famous Alpha CPUs EV4 got this back in 1993. Operating systems will have to support this first, and we don’t expect major performance boosts. Completely exotic is the support for 1 GB pages. 2 MB instead of 4 KB pages make a lot of sense to avoid overwhelming the TLB. But 1 GB pages seem a bit exaggerated until we count our internal RAM in TBs. I was told that a few very exotic HPC applications would be sped up with this.
And then are of course the obligatory new instructions. Six new instructions have been added to accelerate encryption/decryption using AES. The question remains if the performance improvements are worth the extra debugging time. In some rare cases they might be, but we would be lying if we would say we are enthusiastic about yet another SSE instruction.
The SKUs
Below you find an overview of Intel’s newest line-up. We did not include the AMD’s alternatives as the newest AMD Opteron “Magny-cours” will be launched in a few weeks. The current best AMD Opteron, the six-core Opteron 2435 at 2.6 GHz costs $989. It is clear that this pricing will have to be adjusted downwards with the appearance of both Magny Cours and the new six-core Xeon 5600. We expect the Opteron 2435 to compete with one of the quadcore Xeon E5620 to E5640 models.
| Processor | Cores | TDP | Clock Speed | Price | Notes |
| Intel Xeon W5680 | 6 | 130W | 3.3GHz | $1663 | |
| Intel Xeon X5670 | 6 | 95W | 2.93GHz | $1440 | |
| Intel Xeon X5660 | 6 | 95W | 2.80GHz | $1219 | |
| Intel Xeon X5650 | 6 | 95W | 2.66GHz | $996 | |
| Intel Xeon X5677 | 4 | 130W | 3.46GHz | $1663 | Clockspeed optimized quad-core |
| Intel Xeon X5667 | 4 | 95W | 3.06GHz | $1440 | Clockspeed optimized quad-core |
| Intel Xeon E5640 | 4 | 80W | 2.66GHz | $744 | Clockspeed bin higher than E5540 (2.53) |
| Intel Xeon E5630 | 4 | 80W | 2.53GHz | $551 | Clockspeed bin higher than E5530 (2.40) |
| Intel Xeon E5620 | 4 | 80W | 2.40GHz | $387 | Clockspeed bin higher than E5540 (2.26) |
| Intel Xeon L5640 | 6 | 60W | 2.26GHz | $996 | Two extra cores, same TDP as L5520 |
| Intel Xeon L5630 | 4 | 40W | 2.13GHz | $551 | Lowest TDP Rating (5500: 60W) |
| Intel Xeon L5620 | 4 | 40W | 1.86GHz | $440 | No Hyper Threading |
| Intel Xeon E5507 | 4 | 80W | 2.26GHz | $276 | 45nm Nehalem, Clockspeed bin higher than E5506 (2.13) |
| Intel Xeon E5506 | 4 | 80W | 2.13GHz | $219 | 45nm Nehalem, Clockspeed bin higher than E5505 (2.00) |
| Intel Xeon E5503 | 4 | 80W | 2.00 | $188 | 45nm Nehalem, Clockspeed bin higher than E5502 (1.86) |
Pricing stays the same as the Xeon X5500 series. Intel adjusted its Xeon lineup to better address some niche markets. For the HPC folks with poor thread scaling but with high performance demands there is the rather expensive X5677 quadcore at 3.46 GHz. The cost sensitive market is addressed by the E5620, E5630 and E5640 quadcores. Those parts get a speedbump for the same price.
One of the most interesting offerings is the L5630. Chances are high that you are not quickly CPU power limited once you buy a server based on Westmere cores. One CPU can still cope with 8 threads, realistically address up to 72 GB of RAM per CPU (144 GB maximum) and needs only 10W per core.
Benchmark configuration
First of all, I like to offer my thanks to my colleague Tijl Deneut who helped me out with the complex virtualization benchmarks.
None of our benchmarks required more than 20 GB of RAM. Database files were placed on a three drive RAID0 Intel X25-E SLC 32GB SSD, with log files on one Intel X25-E SLC 32GB. Adding more drives improved performance by only 1%, so we are confident that storage is not our bottleneck.
Important note: We threw in our older results of the “Expensive Quad Sockets vs. Ubiquitous Dual Sockets” article. We are well aware that a quad Opteron system is not the natural competitor for a dual Xeon X5670 CPU setup. However, the performance of the quad socket AMD systems should give us a very rough estimate where the new octal core and twelve core Magny Cours Opterons will land. So we reused our 4 month older benchmarks to get an idea what Magny Cours is capable off.
Xeon Server 1: ASUS RS700-E6/RS4 barebone
Dual Intel Xeon "Gainestown" X5570 2.93GHz, Dual Intel Xeon “Westmere” X5670 2.93 GHz
ASUS Z8PS-D12-1U
6x4GB (24GB) ECC Registered DDR3-1333
NIC: Intel 82574L PCI-EGBit LAN
PSU: Delta Electronics DPS-770 AB 770W
Opteron Server 1 (Quad CPU): Supermicro 818TQ+ 1000
Quad AMD Opteron 8435 at 2.6GHz
Quad AMD Opteron 8389 at 2.9GHz
Supermicro H8QMi-2+
64GB (16x4GB) DDR2-800
NIC: Dual Intel PRO/1000 Server NIC
PSU: Supermicro 1000W w/PFC (Model PWS-1K01-1R)
Opteron Server 2 (Dual CPU): Supermicro A+ Server 1021M-UR+V
Dual Opteron 2435 "Istanbul" 2.6GHz
Dual Opteron 2389 2.9GHz
Supermicro H8DMU+
32GB (8x4GB) DDR2 800
PSU: 650W Cold Watt HE Power Solutions CWA2-0650-10-SM01-1
vApus/Oracle Calling Circle Client Configuration
First client (Tile one)
Intel Core 2 Quad Q9550 2.83 GHz
Foxconn P35AX-S
GB (2x2GB) Kingston DDR2-667
NIC: Intel PRO/1000
Second client (Tile two)
Single Xeon X3470 2.93GHz
S3420GPLC
Intel 3420 chipset
8GB (4 x 2GB) 1066MHz DDR3
OLTP benchmark::Oracle Charbench “Calling Circle”
Operating System: Windows 2008 Enterprise RTM (64 bit)
Software: Oracle 10g Release 2 (10.2) for 64 bit Windows
Benchmark software: Swingbench/Charbench 2.2
Database Size: 9 GB
Typical error margin: 2-2.5%
Calling Circle is an Oracle OLTP benchmark. We test with a database size of 9 GB. To reduce the pressure on our storage system, we increased the SGA size (Oracle buffer in RAM) to 10 GB and the PGA size was set at 1.6 GB. A calling circle tests consists of 83% selects, 7% inserts and 10% updates. The “calling circle” test is run for 10 minutes. A run is repeated 6 times and the results of the first run are discarded. The reason is that the disk queue length is sometimes close to 1, while the subsequent runs have a DQL (Disk Queue Length) of 0.2 or lower. In this case it was rather easy to run the CPUs at 99% load. Since DQLs were very similar, we could keep our results from the Nehalem article.
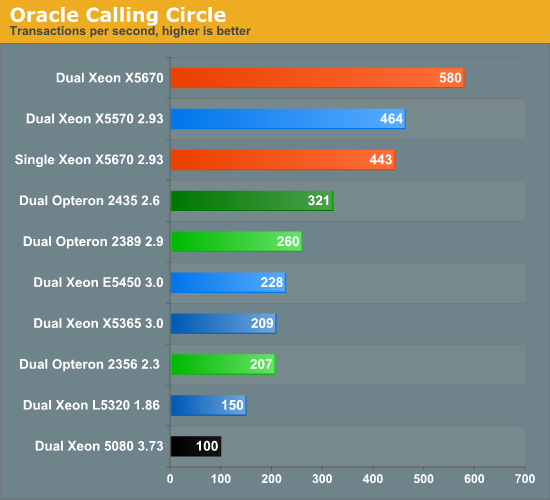
We kept this benchmark setup the same over more than a year of the testing which allows us to offer some historical perspective. Unfortunately the benchmark starts to show its age too. Our disk setup still has a bit of – but not much – headroom, but the scaling is starting to show diminishing returns. If we want to test the full potential of these six-core Xeons and servers with even higher core counts, we will need to increase our database size and as a result the amount of memory we allocate to Oracle.
We expect the Dual Xeon X5670 to be able to do better than the 31% performance increase over a single CPU setup. We saw 100% load for most of the time, but very sharp drops of CPU utilization were also common. But that does not invalidate our results: it just shows that when throwing more and more cores at certain application, you will bump into limits sooner or later. Even on those applications which naturally scale well, the number of scenarios where more cores help will decline.
The real power of the new X5670 is demonstrated by the single CPU results: the X5670 comes close to a dual Xeon X5570 and beats a dual Opteron 2435 by a considerable 38%. This despite the fact that BIOS upgrades and slightly faster memory have allowed the six-core Opteron to become 10% faster. One of the reasons why Intel is slapping the current AMD offerings silly is Hyperthreading, good for 35% performance increase in both the Xeon X5570 and single X5670 setups.
Upgrading from an old top-of-the-line of its time Dual Xeon 5365 3.0 Server to a server with only one six-core delivers twice as much performance. Pretty impressive if you consider the former server is only 3 years old and used two 130W TDP CPUs.
SAP Sales and Distribution 2-tier
The SAP SD (sales and distribution, 2-tier internet configuration) benchmark is an interesting benchmark as it is a real world client-server application. We decided to take a look at SAP's benchmark database. The results below all run on Windows 2003 Enterprise Edition and MS SQL Server 2005 database (both 64-bit). Every 2-tier Sales & Distribution benchmark was performed with SAP's latest ERP 6 enhancement package 4. These results are NOT comparable with any benchmark performed before 2009. The new 2009 version of the benchmark produces scores that are 25% lower. We analyzed the SAP Benchmark in-depth in one of our earlier articles. The profile of the benchmark has remained the same:
| SAP S&D 2-Tier | |
| Operating System | Windows 2008 Enterprise Edition |
| Software | SAP ERP 6.0 Enhancement package 4 |
| Benchmark software | Industry Standard benchmark version 2009 |
| Typical error margin | Very low |
No results were available for the Xeon X5670, so we estimated the expected performance of the Xeon X5670 based on the X5680 result that Fujitsu published and on some preliminary industry reports.
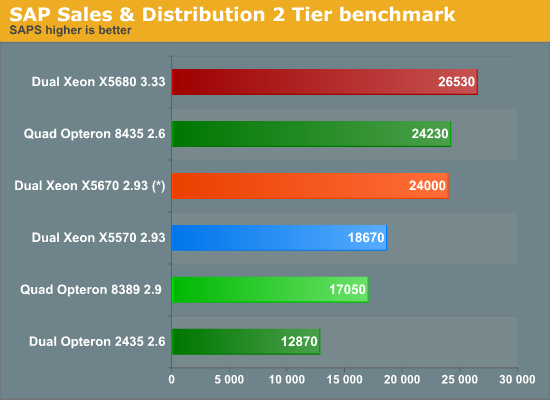
(*) Estimated result
The six-core Xeon is no less than twice (!) as fast as the six-core Opteron in a similar configuration. Pretty dramatic results, but not unexpected of course as the six-core Opteron could never come close to the quadcore Xeons in the first place, let alone an improved six-core version of the latter. The reasons are many-fold, but one of the important ones is the fact that Hyperthreading boosts performance by at least 30%.
Even worse, 12 Westmere cores are enough to come very close to the performance of a 24-core Opteron machine. This is does not bode well for the newest octal and twelve-core Opterons (Magny-cours). To be really frank, we think the SAP market is Intel owned until AMD launches the multi-threaded Bulldozer CPU. Most of the SAP server market is not very sensitive to pricing, let alone CPU pricing. SAP projects, which need expensive licenses and many consulting hours are typically in the $100K to $100M range and x86 hardware costs are most of the time only a small percentage of the total project costs. The final blow is the appearance of the Nehalem EX at the end of this month.
Decision Support benchmark: Nieuws.be
| Decision Support benchmark Nieuws.be | |
| Operating System | Windows 2008 Enterprise RTM (64 bit) |
| Software | SQL Server 2008 Enterprise x64 (64 bit) |
| Benchmark software | vApus + real-world "Nieuws.be" Database |
| Database Size | > 100GB |
| Typical error margin | 1-2% |
The Flemish/Dutch Nieuws.be site is one of the newest web 2.0 websites, launched in 2008. It gathers news from many different sources and allows the reader to completely personalize his view on all this news. Needles to say, the Nieuws.be site is sitting of top of a pretty large database, more than 100 GB and growing. This database consists of a few hundred separate tables, which have been carefully optimized by our lab (the Sizing Server Lab).
Nieuws.be was so kind to let us test the MS SQL 2008 database for CPU benchmarking. We used a log taken between 10 and 11 AM, when traffic is at its peak. VAPUS, the stress testing software developed by the Sizing Server Lab, analyzes this log and simulates real users by performing the actions they performed on the website. In this case we used the resulting load on the database for our test. 99% of the load on the database are selects, about 5% of them are stored procedures. Network traffic is 6.5 MB/s average and 14 MB/s at the most. So our 1 gigabit connection has still a lot of headroom. Disk Queue Length (DQL) is at 2 in the first round of tests, but we only report the results of the subsequent rounds where the database is in a steady state. We measured a DQL close to 0 during these tests, so there is no tangible intervention of the harddisks. This test is as real world as it gets! All servers were tested in a dual CPU configuration.
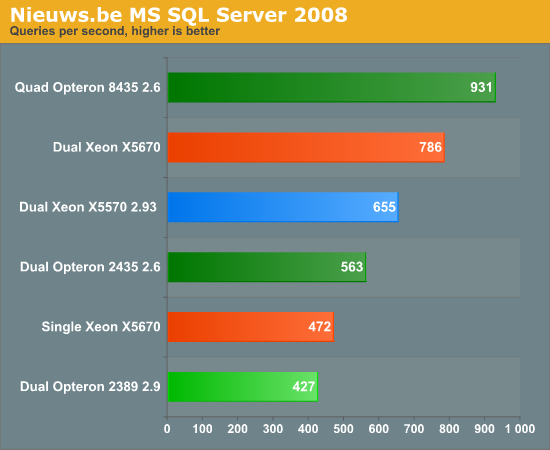
The Dual Xeon X5670 is not scaling so well here, as 50% more cores only result in 20% higher performance. Still, until the newest AMD Opterons arrive, there is not any competition for the six-core Xeon. It outperforms the nearest competitor by 40%.
Virtualization & consolidation
VMmark - which we discussed in great detail here - tries to measure typical consolidation workloads: a combination of a light mail server, database, fileserver, and website with a somewhat heavier java application. One VM is just sitting idle, representative of workloads that have to be online but which perform very little work (for example, a domain controller). In short, VMmark goes for the scenario where you want to consolidate lots and lots of smaller apps on one physical server.
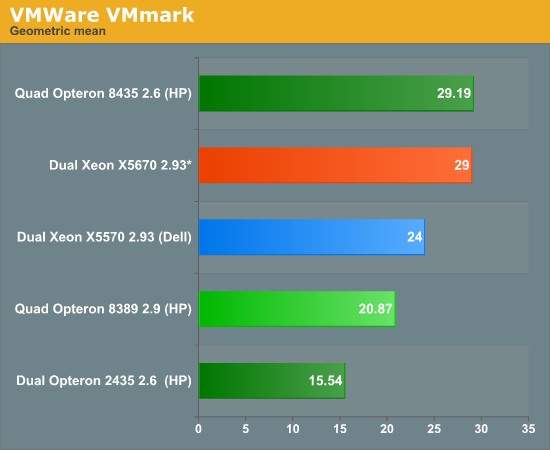
(*) preliminary benchmark data
VMmark is another completely Intel dominated benchmark. One six-core Xeon 2.93 is worth two six-core Opterons at 2.6 GHz. It is important to emphasize that we are talking about benchmark which runs up to 120 VMs, so this benchmark might be influenced greatly by VM exit and entry times. So let us take a look at our own virtualization benchmarks with fewer VM to hypervisor transitions.
vApus Mark I: Performance-Critical applications virtualized
Our vApus Mark I benchmark is not a VMmark replacement. It is meant to be complimentary: while VMmark uses runs 60 to 120 light loads, vApus Mark I runs 8 heavy VMs on 24 virtual CPUs (vCPUs). Our current vApus Stressclient is being improved to scale to much higher amount of vCPUs, but currently we limit the benchmark to 24 virtual CPUs.
A vApus Mark I tile consists of one OLTP, one OLAP and two heavy websites are combined in one tile. These are the kind of demanding applications that still got their own dedicated and natively running machine a year ago. vApus Mark I shows what will happen if you virtualize them. If you want to fully understand our benchmark methodology: vApus Mark I has been described in great detail here. We have changed only one thing compared to our original benchmarking: we used large pages as it is generally considered as a best practice (with RVI, EPT).
The current vApus Mark I uses two tiles. Per tile we have thus 4 VMs with 4 server applications:
- A SQL Server 2008 x64 database running on Windows 2008 64-bit, stress tested by our in-house developed vApus test (4 vCPUs).
- Two heavy duty MCS eFMS portals running PHP, IIS on Windows 2003 R2, stress tested by our in house developed vApus test (each 2 vCPUs).
- One OLTP database, based on Oracle 10G Calling Circle benchmark of Dominic Giles (4 vCPUs).
The beauty is that vApus (stress testing software developed by the Sizing Servers Lab) uses actions made by real people (as can be seen in logs) to stress test the VMs, not some benchmarking algorithm.
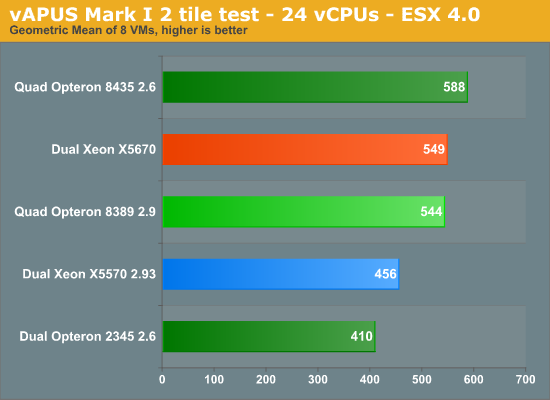
As always, vApus Mark paints a totally different picture than VMmark. In this case, “only” 8 Opteron cores are needed to keep up with the six Xeons. While right now the Xeon X5670 is ahead with a significant margin (34%) on the current six-core Opteron, an octal-core Opteron might be competitive, on the condition that AMD prices it right.
We are proud to present you our first vApus Mark I on Hyper-V. One of the great advantages of our virtualization benchmark is that it runs on all popular hypervisors. Below we tested with Hyper-V R2 6.1.7600.16385 (21st of July 2009).
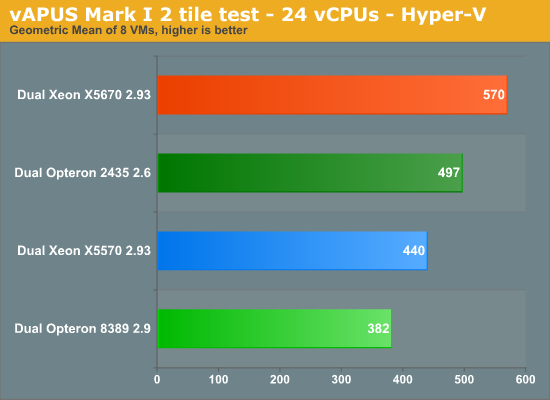
Hyper-V R2 performs well, very well. The scheduler prefers to work with a number of physical CPUs that can be easily divided among the virtual CPUs. Contrary to ESX, where the 16 logical cores of the Xeon X5570 prevail, Hyper-V prefers the twelve cores of the Opteron 2435, much to our surprise. It interesting to see that ESX seems to prefer the Nehalem based architectures much more than Hyper-V. With ESX the gap between the six-core Opteron and six-core Xeon is 34%. With Hyper-V, this shrinks to 15%.
Take our results with a grain of salt though, as this is the very first time we have run vApus Mark I on Hyper-V on different architectures. We need more analyzing time to understand what is going on. My first bet is that ESX is very well optimized for the Nehalem architecture. This includes the excellent Hyper-threading optimizations and probably some optimizations to avoid one of the few Nehalem architecture limitations: the small “prefetch” (16 byte on Nehalem, 32 byte on Istanbul) and especially the relatively small TLB. That is pure speculation though, we will need more time to investigate this.
Final Words
In a few weeks, there will be new dual CPU offerings from both AMD and Intel. We will need to start over again, so any conclusion we make today has a very short lifespan. For those of you who did not find the right benchmark among the ones we presented here, we will add more benchmarks then. Power consumption is also on our to do list. Our first power tests show there is little difference between the power consumption of the same server whether it contains 32 nm six-core X5670 or 45 nm quad-core X5570 CPUs.
So what can we conclude so far? Add two cores and a few tweaks to a server CPU architecture which already has the fastest cores on the market and you’ll get very impressive results. Right now, the six-core Xeon wins every comparison with a similar dual CPU configuration. The interesting thing to note is that the margin varies heavily with the type of application.
ERP applications and OLTP databases benefit a lot from the increased L3-cache, hyperthreading and the extra cores. The result is that those applications show absolutely stunning results for Intel: the dual CPU platform is just as fast as AMD best quad CPU configurations. With twice the amount of performance per core there is simply no other option than Intel.
The a similar picture appears for the well scaling native applications such as OLAP or DSS databases. The Xeon 5670 did not slaughter the competition there, but it was still significantly ahead. Be aware though that many native applications will only scale well in certain scenarios. Database size, usage patterns, disk performance and other factors must all be considered. It is not because your application runs on Oracle or SQL Server that it will automatically make good use of the extra cores and threads. A single six-core Xeon will be fast enough in a lot of cases and a second CPU might only add 30% or so.
The only server of which the performance almost always scales well with extra cores is a virtualized one, providing there are no other hardware bottlenecks of course. If you are shopping around for a server which has to house lots and lots of light VMs (VDI comes to mind), the VMmark results point only in one direction: the new six-core Xeon. At the other end of the performance spectrum is our own “heavy duty” virtualization benchmarking. Running 8 very heavy VMs requiring 24 virtual CPUs runs still best on the Intel Xeon on ESX. When it comes to Hyper-V, the difference is a lot smaller. So for those of you who want to consolidate on Hyper-V, we would advise you to wait a few more weeks. Octal cores from Intel and AMD and twelve-cores from AMD will make the next server CPU comparison much more tense.


